Uruguayan vs Puget Sound Salish Divorced or Separated
COMPARE
Uruguayan
Puget Sound Salish
Divorced or Separated
Divorced or Separated Comparison
Uruguayans
Puget Sound Salish
12.4%
DIVORCED OR SEPARATED
3.4/ 100
METRIC RATING
241st/ 347
METRIC RANK
13.4%
DIVORCED OR SEPARATED
0.0/ 100
METRIC RATING
319th/ 347
METRIC RANK
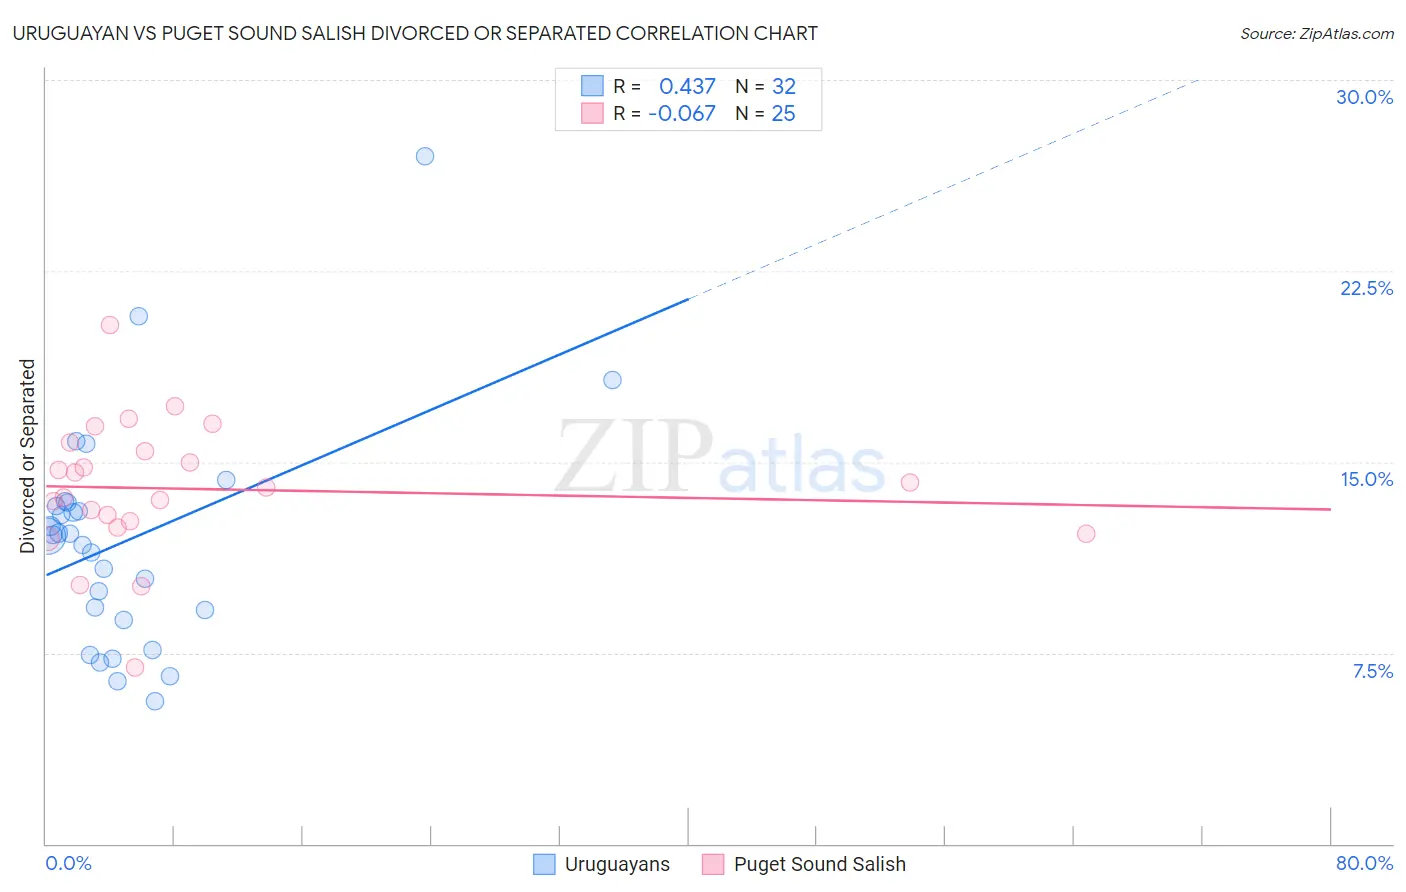
Uruguayan vs Puget Sound Salish Divorced or Separated Correlation Chart
The statistical analysis conducted on geographies consisting of 144,765,430 people shows a moderate positive correlation between the proportion of Uruguayans and percentage of population currently divorced or separated in the United States with a correlation coefficient (R) of 0.437 and weighted average of 12.4%. Similarly, the statistical analysis conducted on geographies consisting of 46,155,746 people shows a slight negative correlation between the proportion of Puget Sound Salish and percentage of population currently divorced or separated in the United States with a correlation coefficient (R) of -0.067 and weighted average of 13.4%, a difference of 7.7%.
Divorced or Separated Correlation Summary
| Measurement | Uruguayan | Puget Sound Salish |
| Minimum | 5.6% | 6.9% |
| Maximum | 27.0% | 20.4% |
| Range | 21.4% | 13.5% |
| Mean | 11.9% | 13.9% |
| Median | 12.1% | 14.0% |
| Interquartile 25% (IQ1) | 9.0% | 12.5% |
| Interquartile 75% (IQ3) | 13.3% | 15.6% |
| Interquartile Range (IQR) | 4.3% | 3.0% |
| Standard Deviation (Sample) | 4.4% | 2.7% |
| Standard Deviation (Population) | 4.3% | 2.6% |
Similar Demographics by Divorced or Separated
Demographics Similar to Uruguayans by Divorced or Separated
In terms of divorced or separated, the demographic groups most similar to Uruguayans are British West Indian (12.4%, a difference of 0.090%), Dutch (12.4%, a difference of 0.090%), Immigrants from Germany (12.4%, a difference of 0.14%), Sudanese (12.4%, a difference of 0.15%), and Immigrants from Latin America (12.4%, a difference of 0.15%).
| Demographics | Rating | Rank | Divorced or Separated |
| West Indians | 4.4 /100 | #234 | Tragic 12.4% |
| Immigrants | Bosnia and Herzegovina | 4.3 /100 | #235 | Tragic 12.4% |
| Colombians | 4.2 /100 | #236 | Tragic 12.4% |
| Immigrants | Laos | 4.2 /100 | #237 | Tragic 12.4% |
| Sudanese | 4.0 /100 | #238 | Tragic 12.4% |
| Immigrants | Germany | 4.0 /100 | #239 | Tragic 12.4% |
| British West Indians | 3.7 /100 | #240 | Tragic 12.4% |
| Uruguayans | 3.4 /100 | #241 | Tragic 12.4% |
| Dutch | 3.1 /100 | #242 | Tragic 12.4% |
| Immigrants | Latin America | 2.8 /100 | #243 | Tragic 12.4% |
| Alaska Natives | 2.5 /100 | #244 | Tragic 12.4% |
| Hispanics or Latinos | 2.0 /100 | #245 | Tragic 12.5% |
| Immigrants | West Indies | 1.9 /100 | #246 | Tragic 12.5% |
| Germans | 1.8 /100 | #247 | Tragic 12.5% |
| Nepalese | 1.8 /100 | #248 | Tragic 12.5% |
Demographics Similar to Puget Sound Salish by Divorced or Separated
In terms of divorced or separated, the demographic groups most similar to Puget Sound Salish are Cree (13.4%, a difference of 0.040%), Haitian (13.3%, a difference of 0.060%), Cajun (13.4%, a difference of 0.060%), Tsimshian (13.3%, a difference of 0.080%), and Spanish American (13.3%, a difference of 0.12%).
| Demographics | Rating | Rank | Divorced or Separated |
| Blackfeet | 0.0 /100 | #312 | Tragic 13.3% |
| Immigrants | Nicaragua | 0.0 /100 | #313 | Tragic 13.3% |
| Yaqui | 0.0 /100 | #314 | Tragic 13.3% |
| Spanish Americans | 0.0 /100 | #315 | Tragic 13.3% |
| Tsimshian | 0.0 /100 | #316 | Tragic 13.3% |
| Haitians | 0.0 /100 | #317 | Tragic 13.3% |
| Cree | 0.0 /100 | #318 | Tragic 13.4% |
| Puget Sound Salish | 0.0 /100 | #319 | Tragic 13.4% |
| Cajuns | 0.0 /100 | #320 | Tragic 13.4% |
| Cheyenne | 0.0 /100 | #321 | Tragic 13.4% |
| Immigrants | Haiti | 0.0 /100 | #322 | Tragic 13.4% |
| U.S. Virgin Islanders | 0.0 /100 | #323 | Tragic 13.4% |
| Osage | 0.0 /100 | #324 | Tragic 13.4% |
| Potawatomi | 0.0 /100 | #325 | Tragic 13.5% |
| Immigrants | Congo | 0.0 /100 | #326 | Tragic 13.5% |