Yakama vs Menominee Family Households with Children
COMPARE
Yakama
Menominee
Family Households with Children
Family Households with Children Comparison
Yakama
Menominee
30.8%
FAMILY HOUSEHOLDS WITH CHILDREN
100.0/ 100
METRIC RATING
8th/ 347
METRIC RANK
27.6%
FAMILY HOUSEHOLDS WITH CHILDREN
78.9/ 100
METRIC RATING
149th/ 347
METRIC RANK
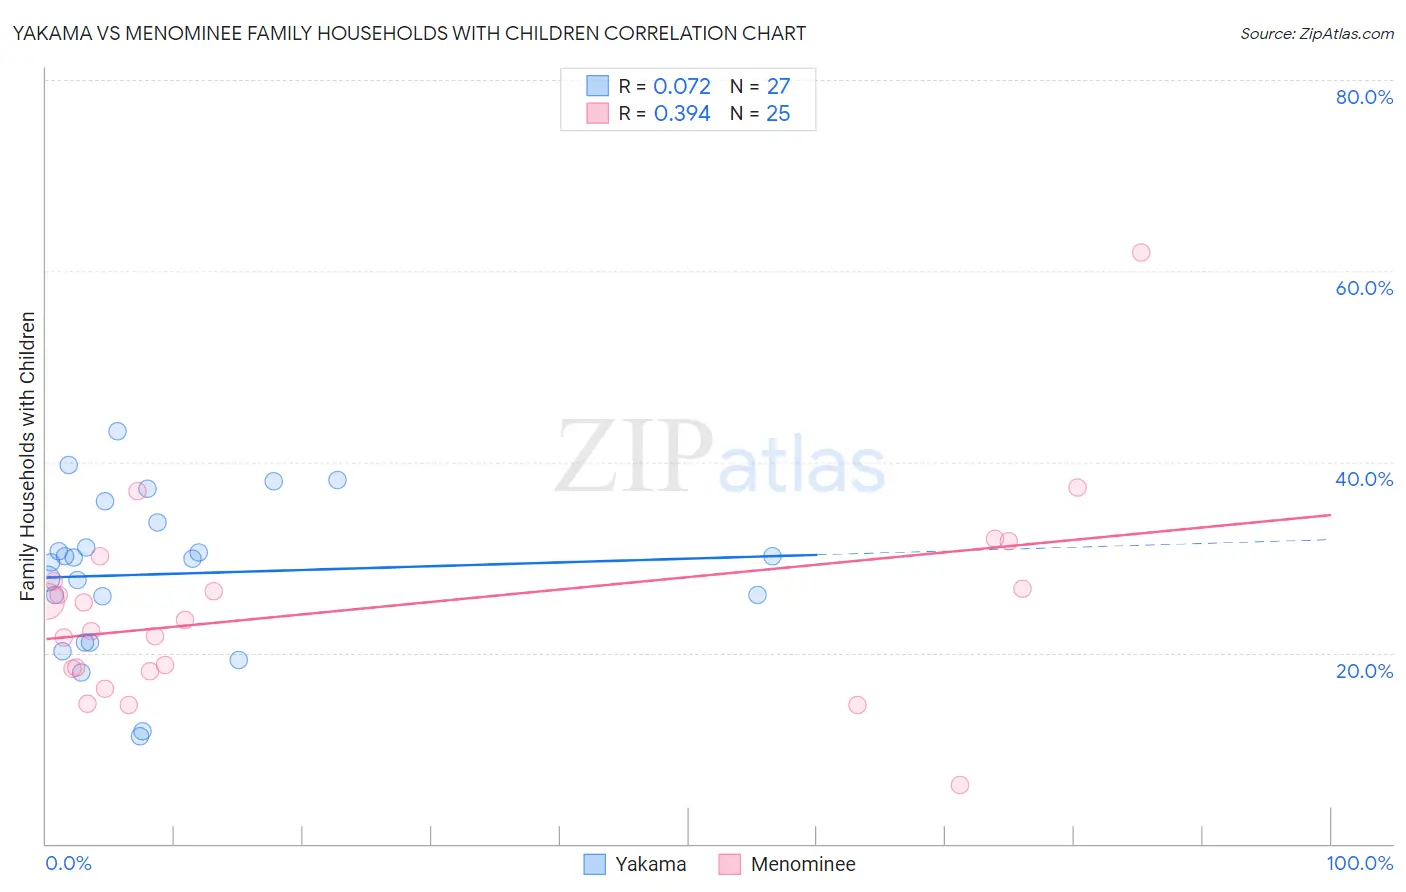
Yakama vs Menominee Family Households with Children Correlation Chart
The statistical analysis conducted on geographies consisting of 19,917,879 people shows a slight positive correlation between the proportion of Yakama and percentage of family households with children in the United States with a correlation coefficient (R) of 0.072 and weighted average of 30.8%. Similarly, the statistical analysis conducted on geographies consisting of 45,777,730 people shows a mild positive correlation between the proportion of Menominee and percentage of family households with children in the United States with a correlation coefficient (R) of 0.394 and weighted average of 27.6%, a difference of 11.3%.
Family Households with Children Correlation Summary
| Measurement | Yakama | Menominee |
| Minimum | 11.2% | 6.1% |
| Maximum | 43.2% | 61.9% |
| Range | 32.0% | 55.8% |
| Mean | 28.3% | 24.6% |
| Median | 29.9% | 23.4% |
| Interquartile 25% (IQ1) | 21.1% | 18.2% |
| Interquartile 75% (IQ3) | 33.7% | 28.8% |
| Interquartile Range (IQR) | 12.6% | 10.6% |
| Standard Deviation (Sample) | 8.0% | 10.7% |
| Standard Deviation (Population) | 7.9% | 10.5% |
Similar Demographics by Family Households with Children
Demographics Similar to Yakama by Family Households with Children
In terms of family households with children, the demographic groups most similar to Yakama are Thai (30.6%, a difference of 0.48%), Immigrants from Central America (31.0%, a difference of 0.57%), Immigrants from Fiji (30.5%, a difference of 0.80%), Immigrants from India (31.0%, a difference of 0.87%), and Nepalese (30.5%, a difference of 0.88%).
| Demographics | Rating | Rank | Family Households with Children |
| Yup'ik | 100 /100 | #1 | Exceptional 37.0% |
| Inupiat | 100 /100 | #2 | Exceptional 32.8% |
| Immigrants | Mexico | 100.0 /100 | #3 | Exceptional 31.6% |
| Mexicans | 100.0 /100 | #4 | Exceptional 31.4% |
| Tongans | 100.0 /100 | #5 | Exceptional 31.2% |
| Immigrants | India | 100.0 /100 | #6 | Exceptional 31.0% |
| Immigrants | Central America | 100.0 /100 | #7 | Exceptional 31.0% |
| Yakama | 100.0 /100 | #8 | Exceptional 30.8% |
| Thais | 100.0 /100 | #9 | Exceptional 30.6% |
| Immigrants | Fiji | 100.0 /100 | #10 | Exceptional 30.5% |
| Nepalese | 100.0 /100 | #11 | Exceptional 30.5% |
| Immigrants | Pakistan | 100.0 /100 | #12 | Exceptional 30.2% |
| Afghans | 100.0 /100 | #13 | Exceptional 30.2% |
| Bangladeshis | 100.0 /100 | #14 | Exceptional 30.1% |
| Immigrants | South Central Asia | 100.0 /100 | #15 | Exceptional 30.0% |
Demographics Similar to Menominee by Family Households with Children
In terms of family households with children, the demographic groups most similar to Menominee are Osage (27.6%, a difference of 0.0%), Immigrants from Moldova (27.6%, a difference of 0.010%), Argentinean (27.6%, a difference of 0.010%), Brazilian (27.7%, a difference of 0.020%), and Immigrants from Chile (27.7%, a difference of 0.020%).
| Demographics | Rating | Rank | Family Households with Children |
| Swiss | 81.4 /100 | #142 | Excellent 27.7% |
| Immigrants | Eastern Africa | 80.2 /100 | #143 | Excellent 27.7% |
| Brazilians | 79.6 /100 | #144 | Good 27.7% |
| Immigrants | Chile | 79.5 /100 | #145 | Good 27.7% |
| Basques | 79.5 /100 | #146 | Good 27.7% |
| Immigrants | Moldova | 79.1 /100 | #147 | Good 27.6% |
| Osage | 79.0 /100 | #148 | Good 27.6% |
| Menominee | 78.9 /100 | #149 | Good 27.6% |
| Argentineans | 78.5 /100 | #150 | Good 27.6% |
| Portuguese | 77.8 /100 | #151 | Good 27.6% |
| Ethiopians | 77.0 /100 | #152 | Good 27.6% |
| Immigrants | Cabo Verde | 75.6 /100 | #153 | Good 27.6% |
| Icelanders | 75.3 /100 | #154 | Good 27.6% |
| Comanche | 74.8 /100 | #155 | Good 27.6% |
| Hungarians | 74.6 /100 | #156 | Good 27.6% |