Korean vs Ghanaian 8th Grade
COMPARE
Korean
Ghanaian
8th Grade
8th Grade Comparison
Koreans
Ghanaians
95.0%
8TH GRADE
1.1/ 100
METRIC RATING
250th/ 347
METRIC RANK
94.9%
8TH GRADE
0.6/ 100
METRIC RATING
259th/ 347
METRIC RANK
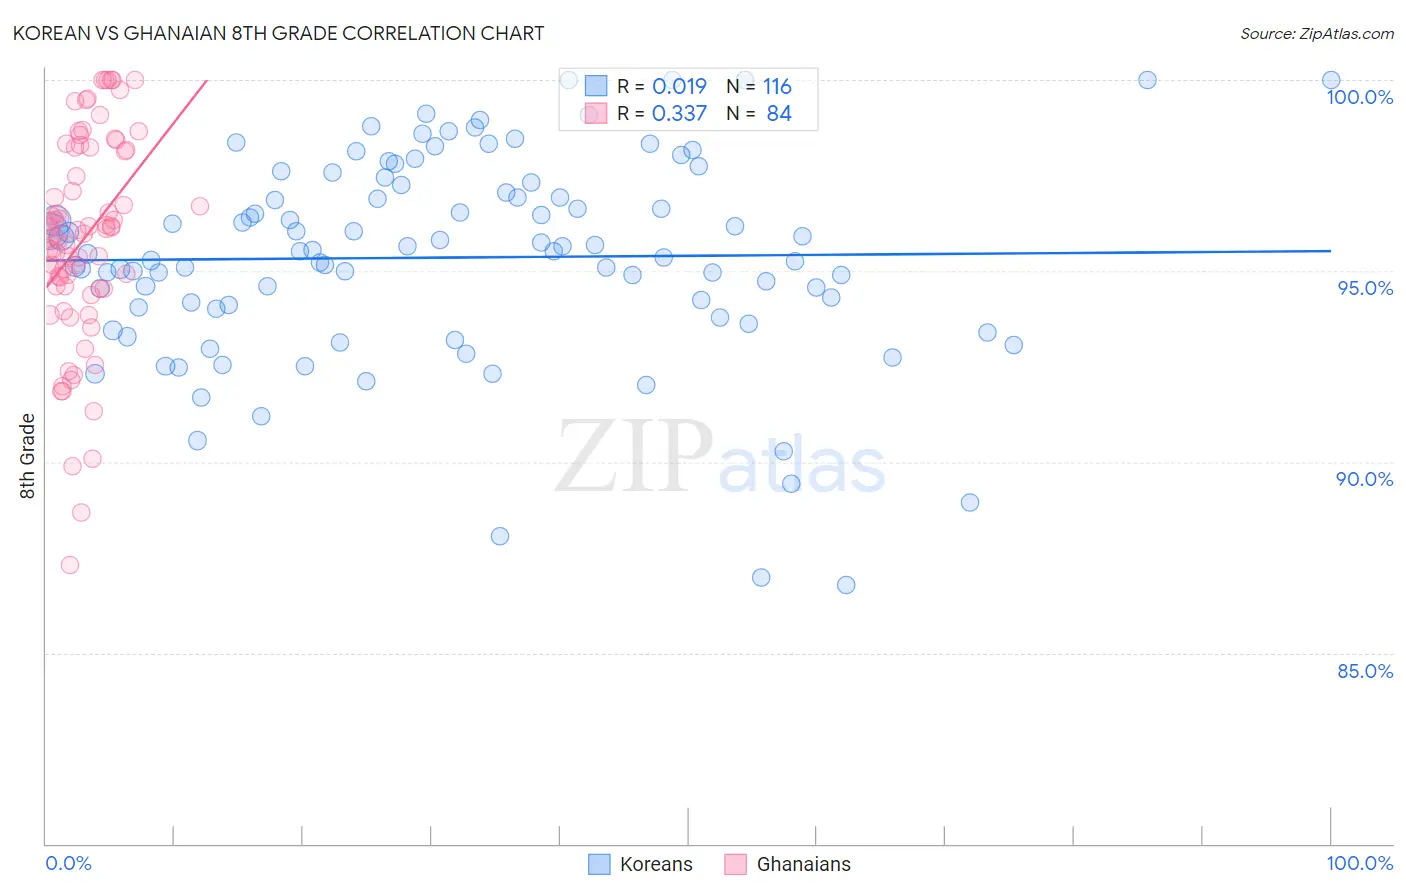
Korean vs Ghanaian 8th Grade Correlation Chart
The statistical analysis conducted on geographies consisting of 510,944,198 people shows no correlation between the proportion of Koreans and percentage of population with at least 8th grade education in the United States with a correlation coefficient (R) of 0.019 and weighted average of 95.0%. Similarly, the statistical analysis conducted on geographies consisting of 190,712,873 people shows a mild positive correlation between the proportion of Ghanaians and percentage of population with at least 8th grade education in the United States with a correlation coefficient (R) of 0.337 and weighted average of 94.9%, a difference of 0.10%.
8th Grade Correlation Summary
| Measurement | Korean | Ghanaian |
| Minimum | 86.8% | 87.3% |
| Maximum | 100.0% | 100.0% |
| Range | 13.2% | 12.7% |
| Mean | 95.3% | 95.8% |
| Median | 95.5% | 96.0% |
| Interquartile 25% (IQ1) | 94.0% | 94.6% |
| Interquartile 75% (IQ3) | 97.1% | 98.2% |
| Interquartile Range (IQR) | 3.1% | 3.6% |
| Standard Deviation (Sample) | 2.7% | 2.7% |
| Standard Deviation (Population) | 2.7% | 2.7% |
Demographics Similar to Koreans and Ghanaians by 8th Grade
In terms of 8th grade, the demographic groups most similar to Koreans are Immigrants from China (95.0%, a difference of 0.0%), Bolivian (95.0%, a difference of 0.010%), Immigrants from Ethiopia (95.0%, a difference of 0.010%), Uruguayan (95.1%, a difference of 0.020%), and U.S. Virgin Islander (95.0%, a difference of 0.020%). Similarly, the demographic groups most similar to Ghanaians are Immigrants from Congo (94.9%, a difference of 0.0%), Immigrants from Jamaica (94.9%, a difference of 0.0%), Afghan (94.9%, a difference of 0.010%), Colombian (95.0%, a difference of 0.020%), and Immigrants from Somalia (95.0%, a difference of 0.030%).
| Demographics | Rating | Rank | 8th Grade |
| Immigrants | Middle Africa | 1.7 /100 | #244 | Tragic 95.1% |
| Jamaicans | 1.4 /100 | #245 | Tragic 95.1% |
| Somalis | 1.4 /100 | #246 | Tragic 95.1% |
| Immigrants | Senegal | 1.4 /100 | #247 | Tragic 95.1% |
| Uruguayans | 1.2 /100 | #248 | Tragic 95.1% |
| Immigrants | China | 1.1 /100 | #249 | Tragic 95.0% |
| Koreans | 1.1 /100 | #250 | Tragic 95.0% |
| Bolivians | 1.0 /100 | #251 | Tragic 95.0% |
| Immigrants | Ethiopia | 1.0 /100 | #252 | Tragic 95.0% |
| U.S. Virgin Islanders | 0.9 /100 | #253 | Tragic 95.0% |
| Immigrants | Cameroon | 0.8 /100 | #254 | Tragic 95.0% |
| Immigrants | Somalia | 0.7 /100 | #255 | Tragic 95.0% |
| Colombians | 0.7 /100 | #256 | Tragic 95.0% |
| Afghans | 0.6 /100 | #257 | Tragic 94.9% |
| Immigrants | Congo | 0.6 /100 | #258 | Tragic 94.9% |
| Ghanaians | 0.6 /100 | #259 | Tragic 94.9% |
| Immigrants | Jamaica | 0.6 /100 | #260 | Tragic 94.9% |
| Immigrants | Costa Rica | 0.5 /100 | #261 | Tragic 94.9% |
| Immigrants | Nigeria | 0.4 /100 | #262 | Tragic 94.9% |
| Immigrants | Hong Kong | 0.4 /100 | #263 | Tragic 94.9% |
| South Americans | 0.4 /100 | #264 | Tragic 94.9% |