Slovene vs Immigrants from Western Europe Births to Unmarried Women
COMPARE
Slovene
Immigrants from Western Europe
Births to Unmarried Women
Births to Unmarried Women Comparison
Slovenes
Immigrants from Western Europe
31.2%
BIRTHS TO UNMARRIED WOMEN
65.9/ 100
METRIC RATING
162nd/ 347
METRIC RANK
31.1%
BIRTHS TO UNMARRIED WOMEN
69.3/ 100
METRIC RATING
160th/ 347
METRIC RANK
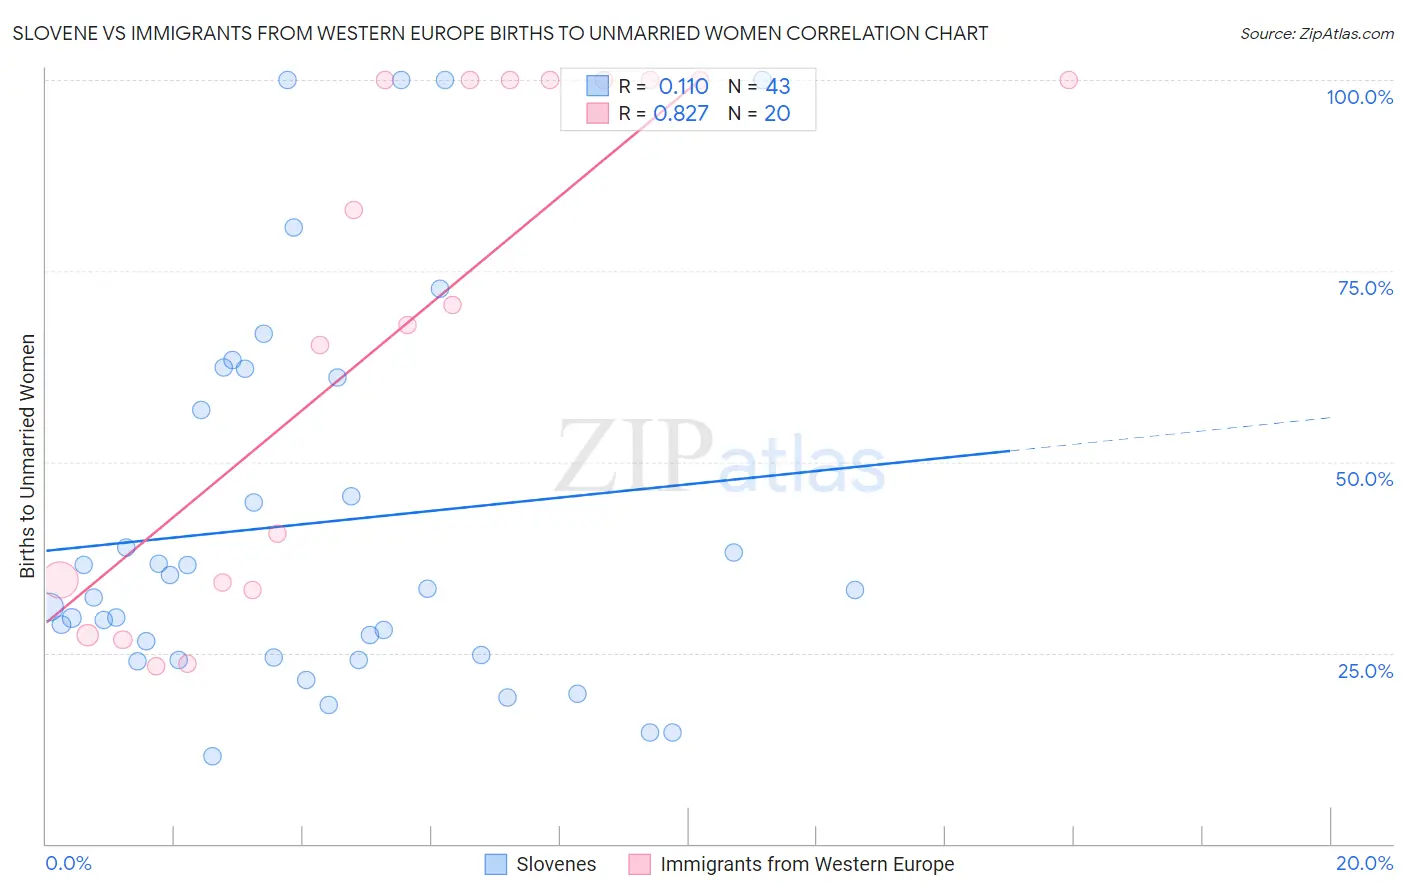
Slovene vs Immigrants from Western Europe Births to Unmarried Women Correlation Chart
The statistical analysis conducted on geographies consisting of 244,653,742 people shows a poor positive correlation between the proportion of Slovenes and percentage of births to unmarried women in the United States with a correlation coefficient (R) of 0.110 and weighted average of 31.2%. Similarly, the statistical analysis conducted on geographies consisting of 450,880,504 people shows a very strong positive correlation between the proportion of Immigrants from Western Europe and percentage of births to unmarried women in the United States with a correlation coefficient (R) of 0.827 and weighted average of 31.1%, a difference of 0.38%.
Births to Unmarried Women Correlation Summary
| Measurement | Slovene | Immigrants from Western Europe |
| Minimum | 11.4% | 23.3% |
| Maximum | 100.0% | 100.0% |
| Range | 88.6% | 76.7% |
| Mean | 42.0% | 66.5% |
| Median | 33.3% | 69.3% |
| Interquartile 25% (IQ1) | 24.4% | 33.7% |
| Interquartile 75% (IQ3) | 61.0% | 100.0% |
| Interquartile Range (IQR) | 36.7% | 66.3% |
| Standard Deviation (Sample) | 25.0% | 32.4% |
| Standard Deviation (Population) | 24.7% | 31.6% |
Demographics Similar to Slovenes and Immigrants from Western Europe by Births to Unmarried Women
In terms of births to unmarried women, the demographic groups most similar to Slovenes are Immigrants from Chile (31.2%, a difference of 0.020%), Hungarian (31.2%, a difference of 0.19%), Immigrants from Southern Europe (31.1%, a difference of 0.31%), Immigrants from England (31.1%, a difference of 0.38%), and Austrian (31.0%, a difference of 0.44%). Similarly, the demographic groups most similar to Immigrants from Western Europe are Immigrants from England (31.1%, a difference of 0.0%), Austrian (31.0%, a difference of 0.060%), Immigrants from Southern Europe (31.1%, a difference of 0.070%), Immigrants from Eastern Africa (31.0%, a difference of 0.33%), and Immigrants from Chile (31.2%, a difference of 0.40%).
| Demographics | Rating | Rank | Births to Unmarried Women |
| Italians | 77.0 /100 | #151 | Good 30.8% |
| Poles | 76.2 /100 | #152 | Good 30.8% |
| British | 76.0 /100 | #153 | Good 30.8% |
| Yugoslavians | 75.1 /100 | #154 | Good 30.8% |
| Immigrants | Bangladesh | 73.9 /100 | #155 | Good 30.9% |
| Carpatho Rusyns | 73.5 /100 | #156 | Good 30.9% |
| Immigrants | Eastern Africa | 72.1 /100 | #157 | Good 31.0% |
| Austrians | 69.9 /100 | #158 | Good 31.0% |
| Immigrants | England | 69.4 /100 | #159 | Good 31.1% |
| Immigrants | Western Europe | 69.3 /100 | #160 | Good 31.1% |
| Immigrants | Southern Europe | 68.7 /100 | #161 | Good 31.1% |
| Slovenes | 65.9 /100 | #162 | Good 31.2% |
| Immigrants | Chile | 65.7 /100 | #163 | Good 31.2% |
| Hungarians | 64.1 /100 | #164 | Good 31.2% |
| Immigrants | Somalia | 58.1 /100 | #165 | Average 31.4% |
| Peruvians | 55.5 /100 | #166 | Average 31.5% |
| Dutch | 55.3 /100 | #167 | Average 31.5% |
| Belgians | 52.4 /100 | #168 | Average 31.6% |
| Slavs | 52.0 /100 | #169 | Average 31.6% |
| Guamanians/Chamorros | 51.3 /100 | #170 | Average 31.6% |
| Finns | 50.5 /100 | #171 | Average 31.7% |