Guyanese vs Lebanese Births to Unmarried Women
COMPARE
Guyanese
Lebanese
Births to Unmarried Women
Births to Unmarried Women Comparison
Guyanese
Lebanese
35.2%
BIRTHS TO UNMARRIED WOMEN
0.9/ 100
METRIC RATING
244th/ 347
METRIC RANK
29.5%
BIRTHS TO UNMARRIED WOMEN
94.4/ 100
METRIC RATING
103rd/ 347
METRIC RANK
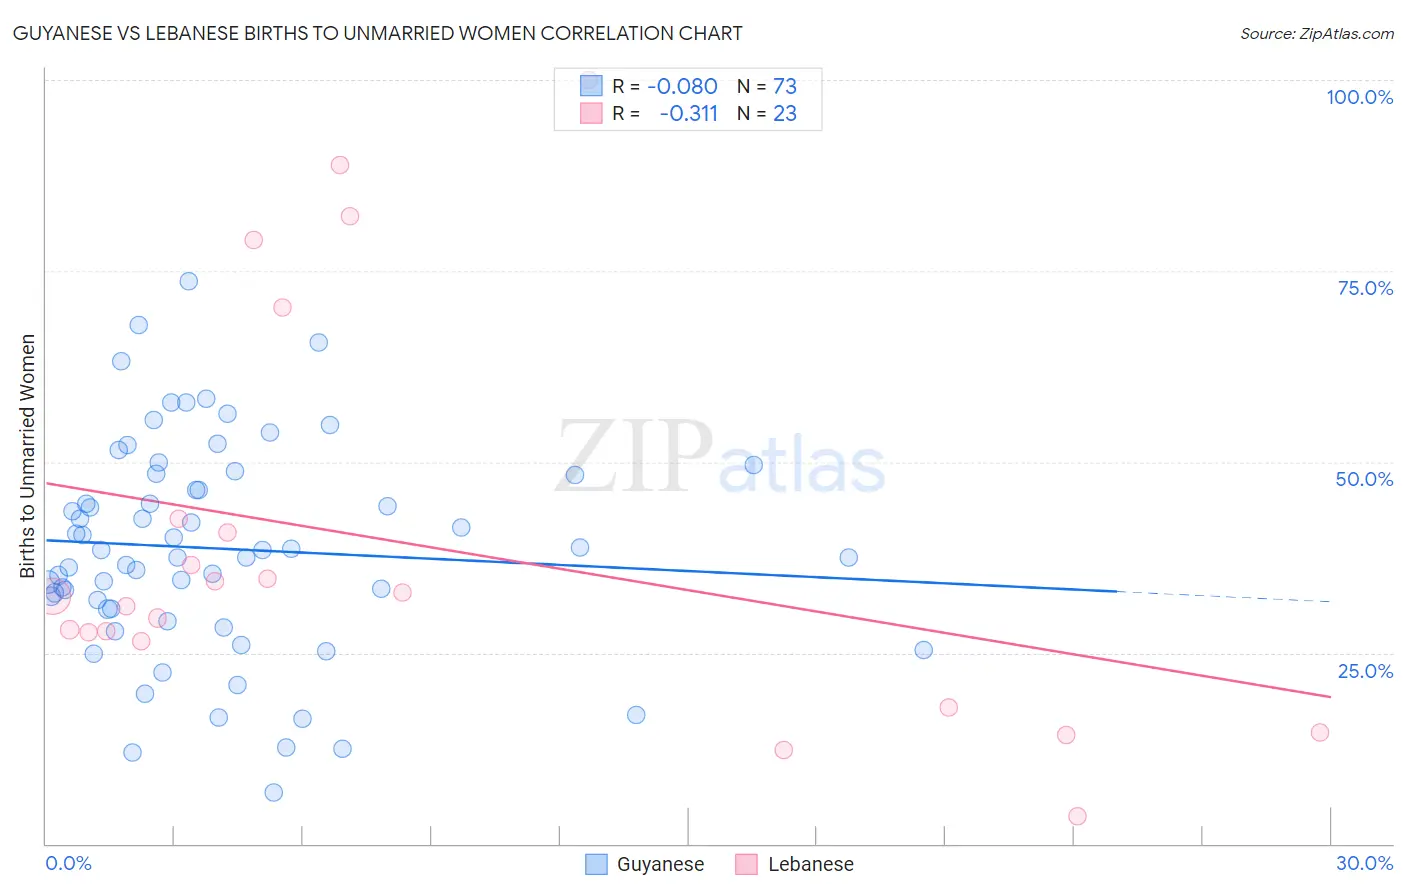
Guyanese vs Lebanese Births to Unmarried Women Correlation Chart
The statistical analysis conducted on geographies consisting of 170,903,529 people shows a slight negative correlation between the proportion of Guyanese and percentage of births to unmarried women in the United States with a correlation coefficient (R) of -0.080 and weighted average of 35.2%. Similarly, the statistical analysis conducted on geographies consisting of 372,610,698 people shows a mild negative correlation between the proportion of Lebanese and percentage of births to unmarried women in the United States with a correlation coefficient (R) of -0.311 and weighted average of 29.5%, a difference of 19.1%.
Births to Unmarried Women Correlation Summary
| Measurement | Guyanese | Lebanese |
| Minimum | 6.7% | 3.6% |
| Maximum | 73.7% | 100.0% |
| Range | 67.0% | 96.4% |
| Mean | 38.6% | 39.5% |
| Median | 38.4% | 32.4% |
| Interquartile 25% (IQ1) | 30.7% | 26.4% |
| Interquartile 75% (IQ3) | 48.3% | 42.6% |
| Interquartile Range (IQR) | 17.6% | 16.2% |
| Standard Deviation (Sample) | 13.9% | 26.2% |
| Standard Deviation (Population) | 13.8% | 25.6% |
Similar Demographics by Births to Unmarried Women
Demographics Similar to Guyanese by Births to Unmarried Women
In terms of births to unmarried women, the demographic groups most similar to Guyanese are Japanese (35.2%, a difference of 0.060%), Shoshone (35.3%, a difference of 0.34%), Nigerian (35.3%, a difference of 0.45%), Indonesian (35.0%, a difference of 0.55%), and Immigrants from Guyana (35.0%, a difference of 0.65%).
| Demographics | Rating | Rank | Births to Unmarried Women |
| Marshallese | 1.6 /100 | #237 | Tragic 34.8% |
| Immigrants | Cambodia | 1.6 /100 | #238 | Tragic 34.8% |
| Sierra Leoneans | 1.4 /100 | #239 | Tragic 34.9% |
| Immigrants | Middle Africa | 1.2 /100 | #240 | Tragic 34.9% |
| Immigrants | Guyana | 1.2 /100 | #241 | Tragic 35.0% |
| Indonesians | 1.2 /100 | #242 | Tragic 35.0% |
| Japanese | 0.9 /100 | #243 | Tragic 35.2% |
| Guyanese | 0.9 /100 | #244 | Tragic 35.2% |
| Shoshone | 0.8 /100 | #245 | Tragic 35.3% |
| Nigerians | 0.7 /100 | #246 | Tragic 35.3% |
| Immigrants | Nigeria | 0.7 /100 | #247 | Tragic 35.4% |
| Immigrants | Nonimmigrants | 0.6 /100 | #248 | Tragic 35.5% |
| Bermudans | 0.6 /100 | #249 | Tragic 35.5% |
| Mexican American Indians | 0.4 /100 | #250 | Tragic 35.7% |
| Immigrants | Western Africa | 0.3 /100 | #251 | Tragic 36.0% |
Demographics Similar to Lebanese by Births to Unmarried Women
In terms of births to unmarried women, the demographic groups most similar to Lebanese are Lithuanian (29.6%, a difference of 0.010%), Australian (29.5%, a difference of 0.050%), Immigrants from Nepal (29.6%, a difference of 0.060%), Immigrants from Northern Africa (29.5%, a difference of 0.13%), and Swedish (29.6%, a difference of 0.32%).
| Demographics | Rating | Rank | Births to Unmarried Women |
| Norwegians | 95.8 /100 | #96 | Exceptional 29.3% |
| Immigrants | South Africa | 95.7 /100 | #97 | Exceptional 29.3% |
| Immigrants | Syria | 95.7 /100 | #98 | Exceptional 29.4% |
| Immigrants | Denmark | 95.3 /100 | #99 | Exceptional 29.4% |
| Luxembourgers | 95.2 /100 | #100 | Exceptional 29.4% |
| Immigrants | Northern Africa | 94.7 /100 | #101 | Exceptional 29.5% |
| Australians | 94.6 /100 | #102 | Exceptional 29.5% |
| Lebanese | 94.4 /100 | #103 | Exceptional 29.5% |
| Lithuanians | 94.4 /100 | #104 | Exceptional 29.6% |
| Immigrants | Nepal | 94.3 /100 | #105 | Exceptional 29.6% |
| Swedes | 93.8 /100 | #106 | Exceptional 29.6% |
| Immigrants | Brazil | 93.7 /100 | #107 | Exceptional 29.6% |
| Paraguayans | 93.5 /100 | #108 | Exceptional 29.7% |
| Greeks | 93.4 /100 | #109 | Exceptional 29.7% |
| Immigrants | Ethiopia | 93.4 /100 | #110 | Exceptional 29.7% |