Immigrants from Europe vs Laotian Single Mother Households
COMPARE
Immigrants from Europe
Laotian
Single Mother Households
Single Mother Households Comparison
Immigrants from Europe
Laotians
5.5%
SINGLE MOTHER HOUSEHOLDS
99.0/ 100
METRIC RATING
57th/ 347
METRIC RANK
5.8%
SINGLE MOTHER HOUSEHOLDS
94.3/ 100
METRIC RATING
118th/ 347
METRIC RANK
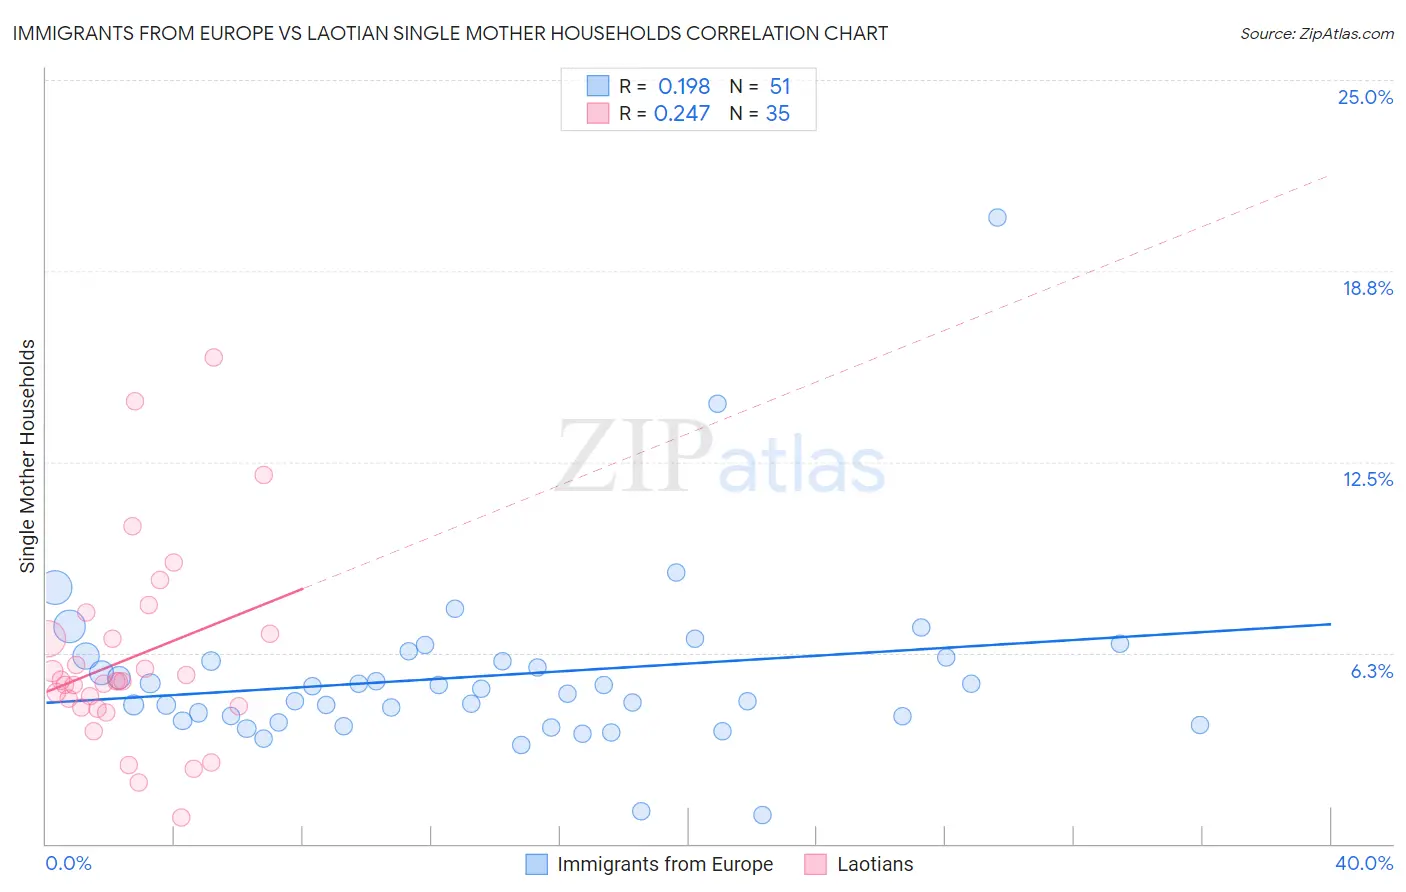
Immigrants from Europe vs Laotian Single Mother Households Correlation Chart
The statistical analysis conducted on geographies consisting of 543,439,256 people shows a poor positive correlation between the proportion of Immigrants from Europe and percentage of single mother households in the United States with a correlation coefficient (R) of 0.198 and weighted average of 5.5%. Similarly, the statistical analysis conducted on geographies consisting of 224,525,105 people shows a weak positive correlation between the proportion of Laotians and percentage of single mother households in the United States with a correlation coefficient (R) of 0.247 and weighted average of 5.8%, a difference of 5.6%.
Single Mother Households Correlation Summary
| Measurement | Immigrants from Europe | Laotian |
| Minimum | 0.93% | 0.87% |
| Maximum | 20.5% | 15.9% |
| Range | 19.6% | 15.0% |
| Mean | 5.5% | 6.1% |
| Median | 5.1% | 5.3% |
| Interquartile 25% (IQ1) | 4.0% | 4.5% |
| Interquartile 75% (IQ3) | 6.1% | 6.9% |
| Interquartile Range (IQR) | 2.1% | 2.4% |
| Standard Deviation (Sample) | 2.9% | 3.2% |
| Standard Deviation (Population) | 2.9% | 3.2% |
Similar Demographics by Single Mother Households
Demographics Similar to Immigrants from Europe by Single Mother Households
In terms of single mother households, the demographic groups most similar to Immigrants from Europe are Immigrants from Romania (5.5%, a difference of 0.080%), Immigrants from Denmark (5.5%, a difference of 0.15%), Danish (5.5%, a difference of 0.24%), Immigrants from Lebanon (5.5%, a difference of 0.32%), and Immigrants from Russia (5.5%, a difference of 0.34%).
| Demographics | Rating | Rank | Single Mother Households |
| Immigrants | Scotland | 99.2 /100 | #50 | Exceptional 5.5% |
| Immigrants | Belarus | 99.2 /100 | #51 | Exceptional 5.5% |
| Swedes | 99.1 /100 | #52 | Exceptional 5.5% |
| Immigrants | Russia | 99.1 /100 | #53 | Exceptional 5.5% |
| Immigrants | Lebanon | 99.1 /100 | #54 | Exceptional 5.5% |
| Immigrants | Denmark | 99.1 /100 | #55 | Exceptional 5.5% |
| Immigrants | Romania | 99.0 /100 | #56 | Exceptional 5.5% |
| Immigrants | Europe | 99.0 /100 | #57 | Exceptional 5.5% |
| Danes | 98.9 /100 | #58 | Exceptional 5.5% |
| Luxembourgers | 98.7 /100 | #59 | Exceptional 5.6% |
| Immigrants | Norway | 98.7 /100 | #60 | Exceptional 5.6% |
| Australians | 98.7 /100 | #61 | Exceptional 5.6% |
| Poles | 98.6 /100 | #62 | Exceptional 5.6% |
| Immigrants | North Macedonia | 98.6 /100 | #63 | Exceptional 5.6% |
| Immigrants | France | 98.6 /100 | #64 | Exceptional 5.6% |
Demographics Similar to Laotians by Single Mother Households
In terms of single mother households, the demographic groups most similar to Laotians are South African (5.8%, a difference of 0.11%), Bolivian (5.8%, a difference of 0.18%), Pennsylvania German (5.8%, a difference of 0.25%), Tongan (5.8%, a difference of 0.30%), and Irish (5.8%, a difference of 0.32%).
| Demographics | Rating | Rank | Single Mother Households |
| Immigrants | England | 95.5 /100 | #111 | Exceptional 5.8% |
| Immigrants | Kuwait | 95.4 /100 | #112 | Exceptional 5.8% |
| Mongolians | 95.3 /100 | #113 | Exceptional 5.8% |
| Dutch | 95.1 /100 | #114 | Exceptional 5.8% |
| Irish | 94.8 /100 | #115 | Exceptional 5.8% |
| Pennsylvania Germans | 94.7 /100 | #116 | Exceptional 5.8% |
| Bolivians | 94.6 /100 | #117 | Exceptional 5.8% |
| Laotians | 94.3 /100 | #118 | Exceptional 5.8% |
| South Africans | 94.1 /100 | #119 | Exceptional 5.8% |
| Tongans | 93.7 /100 | #120 | Exceptional 5.8% |
| Argentineans | 93.7 /100 | #121 | Exceptional 5.8% |
| Belgians | 93.5 /100 | #122 | Exceptional 5.8% |
| Immigrants | Uzbekistan | 93.4 /100 | #123 | Exceptional 5.9% |
| Immigrants | Argentina | 93.2 /100 | #124 | Exceptional 5.9% |
| Slavs | 92.9 /100 | #125 | Exceptional 5.9% |