Immigrants from Morocco vs Afghan Single Father Households
COMPARE
Immigrants from Morocco
Afghan
Single Father Households
Single Father Households Comparison
Immigrants from Morocco
Afghans
2.2%
SINGLE FATHER HOUSEHOLDS
97.8/ 100
METRIC RATING
118th/ 347
METRIC RANK
2.3%
SINGLE FATHER HOUSEHOLDS
50.0/ 100
METRIC RATING
174th/ 347
METRIC RANK
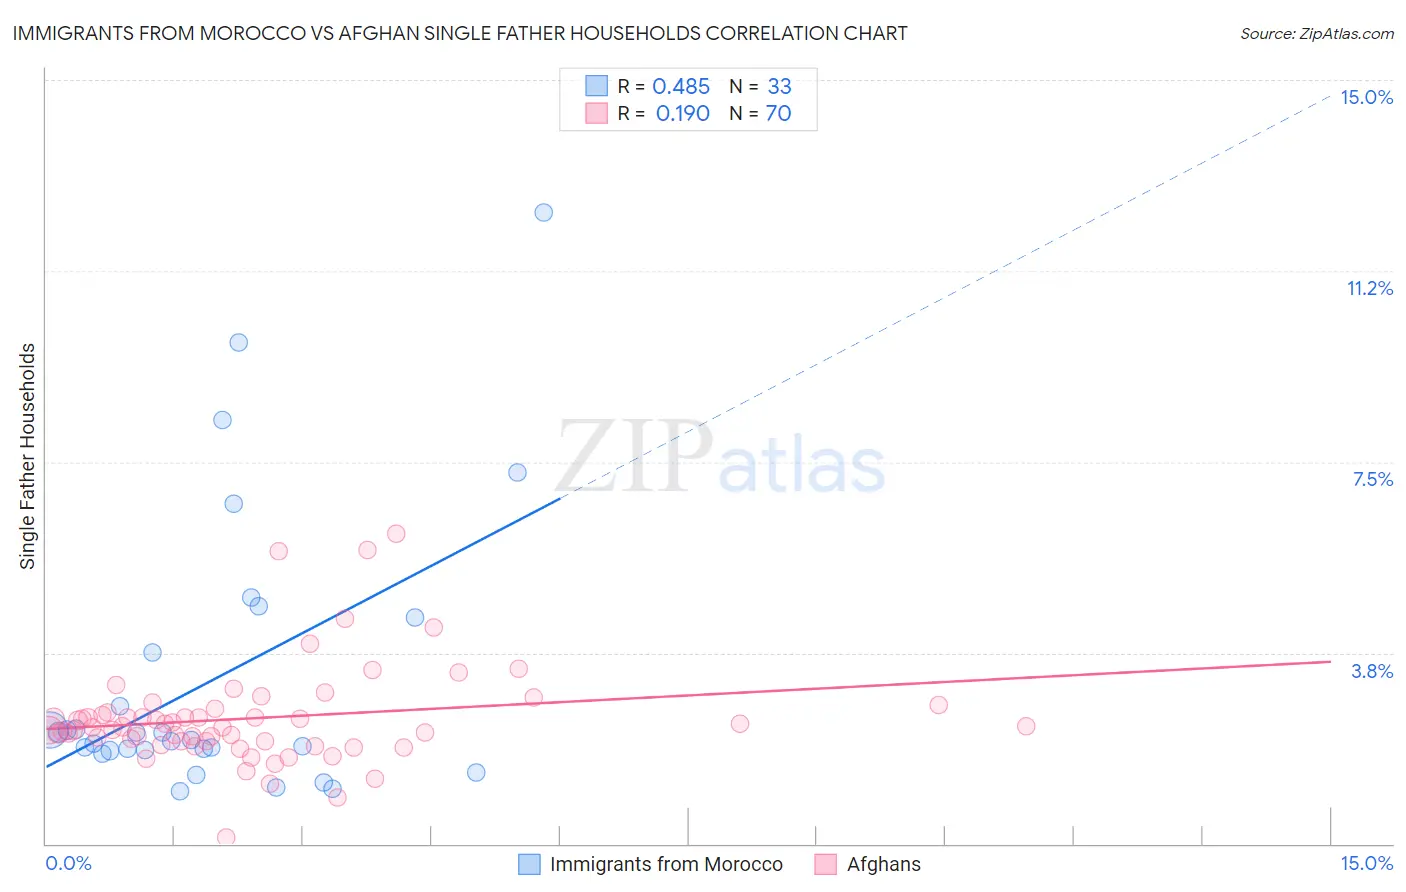
Immigrants from Morocco vs Afghan Single Father Households Correlation Chart
The statistical analysis conducted on geographies consisting of 178,475,316 people shows a moderate positive correlation between the proportion of Immigrants from Morocco and percentage of single father households in the United States with a correlation coefficient (R) of 0.485 and weighted average of 2.2%. Similarly, the statistical analysis conducted on geographies consisting of 148,375,080 people shows a poor positive correlation between the proportion of Afghans and percentage of single father households in the United States with a correlation coefficient (R) of 0.190 and weighted average of 2.3%, a difference of 7.5%.
Single Father Households Correlation Summary
| Measurement | Immigrants from Morocco | Afghan |
| Minimum | 1.0% | 0.11% |
| Maximum | 12.4% | 6.1% |
| Range | 11.4% | 6.0% |
| Mean | 3.2% | 2.5% |
| Median | 2.0% | 2.3% |
| Interquartile 25% (IQ1) | 1.8% | 2.0% |
| Interquartile 75% (IQ3) | 4.1% | 2.6% |
| Interquartile Range (IQR) | 2.3% | 0.57% |
| Standard Deviation (Sample) | 2.7% | 0.99% |
| Standard Deviation (Population) | 2.7% | 0.98% |
Similar Demographics by Single Father Households
Demographics Similar to Immigrants from Morocco by Single Father Households
In terms of single father households, the demographic groups most similar to Immigrants from Morocco are Trinidadian and Tobagonian (2.2%, a difference of 0.060%), Australian (2.2%, a difference of 0.090%), Immigrants from Brazil (2.2%, a difference of 0.090%), Hungarian (2.2%, a difference of 0.10%), and Immigrants from Iraq (2.2%, a difference of 0.19%).
| Demographics | Rating | Rank | Single Father Households |
| Immigrants | Canada | 98.3 /100 | #111 | Exceptional 2.2% |
| Immigrants | Trinidad and Tobago | 98.2 /100 | #112 | Exceptional 2.2% |
| Iraqis | 98.2 /100 | #113 | Exceptional 2.2% |
| Immigrants | North America | 98.2 /100 | #114 | Exceptional 2.2% |
| Immigrants | Barbados | 98.2 /100 | #115 | Exceptional 2.2% |
| Immigrants | Argentina | 98.1 /100 | #116 | Exceptional 2.2% |
| Hungarians | 97.9 /100 | #117 | Exceptional 2.2% |
| Immigrants | Morocco | 97.8 /100 | #118 | Exceptional 2.2% |
| Trinidadians and Tobagonians | 97.8 /100 | #119 | Exceptional 2.2% |
| Australians | 97.7 /100 | #120 | Exceptional 2.2% |
| Immigrants | Brazil | 97.7 /100 | #121 | Exceptional 2.2% |
| Immigrants | Iraq | 97.6 /100 | #122 | Exceptional 2.2% |
| Immigrants | Yemen | 97.5 /100 | #123 | Exceptional 2.2% |
| British West Indians | 97.4 /100 | #124 | Exceptional 2.2% |
| Immigrants | Indonesia | 97.4 /100 | #125 | Exceptional 2.2% |
Demographics Similar to Afghans by Single Father Households
In terms of single father households, the demographic groups most similar to Afghans are Immigrants from Jamaica (2.3%, a difference of 0.070%), Danish (2.3%, a difference of 0.13%), Colombian (2.3%, a difference of 0.14%), Celtic (2.3%, a difference of 0.40%), and Costa Rican (2.3%, a difference of 0.44%).
| Demographics | Rating | Rank | Single Father Households |
| South Americans | 64.3 /100 | #167 | Good 2.3% |
| Icelanders | 63.1 /100 | #168 | Good 2.3% |
| Czechs | 62.5 /100 | #169 | Good 2.3% |
| Ugandans | 62.2 /100 | #170 | Good 2.3% |
| Swedes | 61.6 /100 | #171 | Good 2.3% |
| Czechoslovakians | 58.9 /100 | #172 | Average 2.3% |
| Celtics | 55.4 /100 | #173 | Average 2.3% |
| Afghans | 50.0 /100 | #174 | Average 2.3% |
| Immigrants | Jamaica | 49.1 /100 | #175 | Average 2.3% |
| Danes | 48.2 /100 | #176 | Average 2.3% |
| Colombians | 48.0 /100 | #177 | Average 2.3% |
| Costa Ricans | 44.1 /100 | #178 | Average 2.3% |
| Welsh | 44.0 /100 | #179 | Average 2.3% |
| Yugoslavians | 43.9 /100 | #180 | Average 2.3% |
| Jamaicans | 43.5 /100 | #181 | Average 2.3% |