Israeli vs Samoan Average Family Size
COMPARE
Israeli
Samoan
Average Family Size
Average Family Size Comparison
Israelis
Samoans
3.23
AVERAGE FAMILY SIZE
48.7/ 100
METRIC RATING
176th/ 347
METRIC RANK
3.42
AVERAGE FAMILY SIZE
100.0/ 100
METRIC RATING
30th/ 347
METRIC RANK
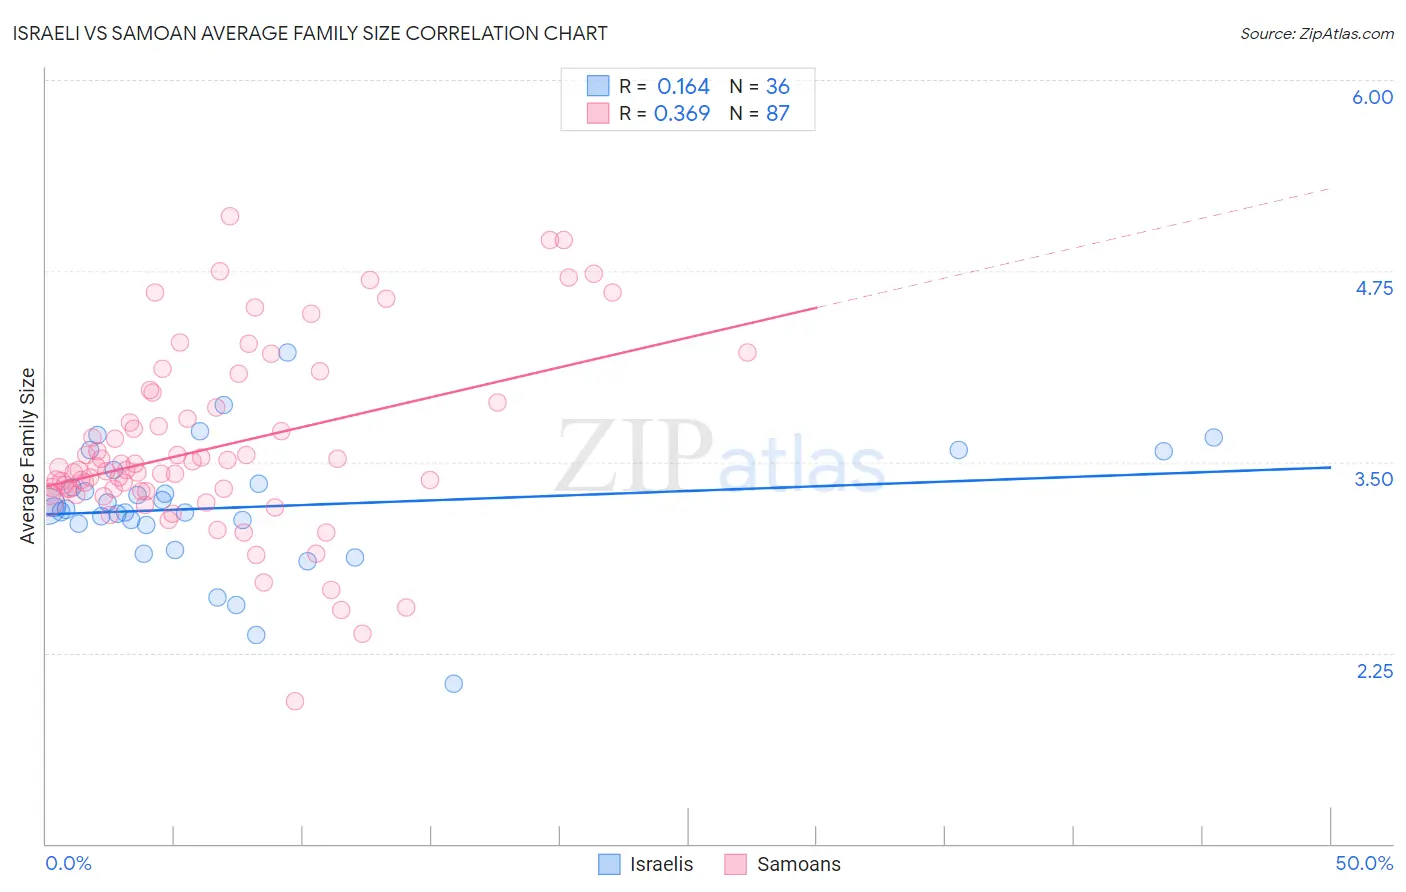
Israeli vs Samoan Average Family Size Correlation Chart
The statistical analysis conducted on geographies consisting of 211,000,006 people shows a poor positive correlation between the proportion of Israelis and average family size in the United States with a correlation coefficient (R) of 0.164 and weighted average of 3.23. Similarly, the statistical analysis conducted on geographies consisting of 225,071,591 people shows a mild positive correlation between the proportion of Samoans and average family size in the United States with a correlation coefficient (R) of 0.369 and weighted average of 3.42, a difference of 5.9%.
Average Family Size Correlation Summary
| Measurement | Israeli | Samoan |
| Minimum | 2.05 | 1.93 |
| Maximum | 4.22 | 5.11 |
| Range | 2.17 | 3.18 |
| Mean | 3.20 | 3.60 |
| Median | 3.20 | 3.45 |
| Interquartile 25% (IQ1) | 3.09 | 3.30 |
| Interquartile 75% (IQ3) | 3.40 | 3.89 |
| Interquartile Range (IQR) | 0.31 | 0.58 |
| Standard Deviation (Sample) | 0.41 | 0.60 |
| Standard Deviation (Population) | 0.41 | 0.60 |
Similar Demographics by Average Family Size
Demographics Similar to Israelis by Average Family Size
In terms of average family size, the demographic groups most similar to Israelis are Immigrants from South Central Asia (3.23, a difference of 0.020%), Immigrants from China (3.23, a difference of 0.020%), Argentinean (3.23, a difference of 0.020%), Spaniard (3.23, a difference of 0.030%), and Immigrants from Korea (3.23, a difference of 0.030%).
| Demographics | Rating | Rank | Average Family Size |
| Aleuts | 54.1 /100 | #169 | Average 3.23 |
| Arabs | 53.8 /100 | #170 | Average 3.23 |
| Chileans | 53.2 /100 | #171 | Average 3.23 |
| Immigrants | Congo | 52.7 /100 | #172 | Average 3.23 |
| Immigrants | Uruguay | 52.0 /100 | #173 | Average 3.23 |
| Immigrants | South Central Asia | 50.0 /100 | #174 | Average 3.23 |
| Immigrants | China | 49.9 /100 | #175 | Average 3.23 |
| Israelis | 48.7 /100 | #176 | Average 3.23 |
| Argentineans | 47.4 /100 | #177 | Average 3.23 |
| Spaniards | 47.2 /100 | #178 | Average 3.23 |
| Immigrants | Korea | 46.9 /100 | #179 | Average 3.23 |
| Palestinians | 46.6 /100 | #180 | Average 3.23 |
| Spanish | 44.8 /100 | #181 | Average 3.23 |
| Moroccans | 44.2 /100 | #182 | Average 3.22 |
| Immigrants | Northern Africa | 41.7 /100 | #183 | Average 3.22 |
Demographics Similar to Samoans by Average Family Size
In terms of average family size, the demographic groups most similar to Samoans are Nepalese (3.42, a difference of 0.030%), Immigrants from Latin America (3.42, a difference of 0.12%), Central American (3.41, a difference of 0.20%), Mexican American Indian (3.43, a difference of 0.24%), and Native Hawaiian (3.43, a difference of 0.25%).
| Demographics | Rating | Rank | Average Family Size |
| Immigrants | Fiji | 100.0 /100 | #23 | Exceptional 3.45 |
| Natives/Alaskans | 100.0 /100 | #24 | Exceptional 3.45 |
| Yakama | 100.0 /100 | #25 | Exceptional 3.45 |
| Native Hawaiians | 100.0 /100 | #26 | Exceptional 3.43 |
| Mexican American Indians | 100.0 /100 | #27 | Exceptional 3.43 |
| Immigrants | Latin America | 100.0 /100 | #28 | Exceptional 3.42 |
| Nepalese | 100.0 /100 | #29 | Exceptional 3.42 |
| Samoans | 100.0 /100 | #30 | Exceptional 3.42 |
| Central Americans | 100.0 /100 | #31 | Exceptional 3.41 |
| Immigrants | Guatemala | 100.0 /100 | #32 | Exceptional 3.41 |
| Hawaiians | 100.0 /100 | #33 | Exceptional 3.41 |
| Hispanics or Latinos | 100.0 /100 | #34 | Exceptional 3.41 |
| Guatemalans | 100.0 /100 | #35 | Exceptional 3.40 |
| Immigrants | Guyana | 100.0 /100 | #36 | Exceptional 3.40 |
| Guyanese | 100.0 /100 | #37 | Exceptional 3.40 |