Israeli vs Immigrants from Japan Average Family Size
COMPARE
Israeli
Immigrants from Japan
Average Family Size
Average Family Size Comparison
Israelis
Immigrants from Japan
3.23
AVERAGE FAMILY SIZE
48.7/ 100
METRIC RATING
176th/ 347
METRIC RANK
3.18
AVERAGE FAMILY SIZE
3.0/ 100
METRIC RATING
241st/ 347
METRIC RANK
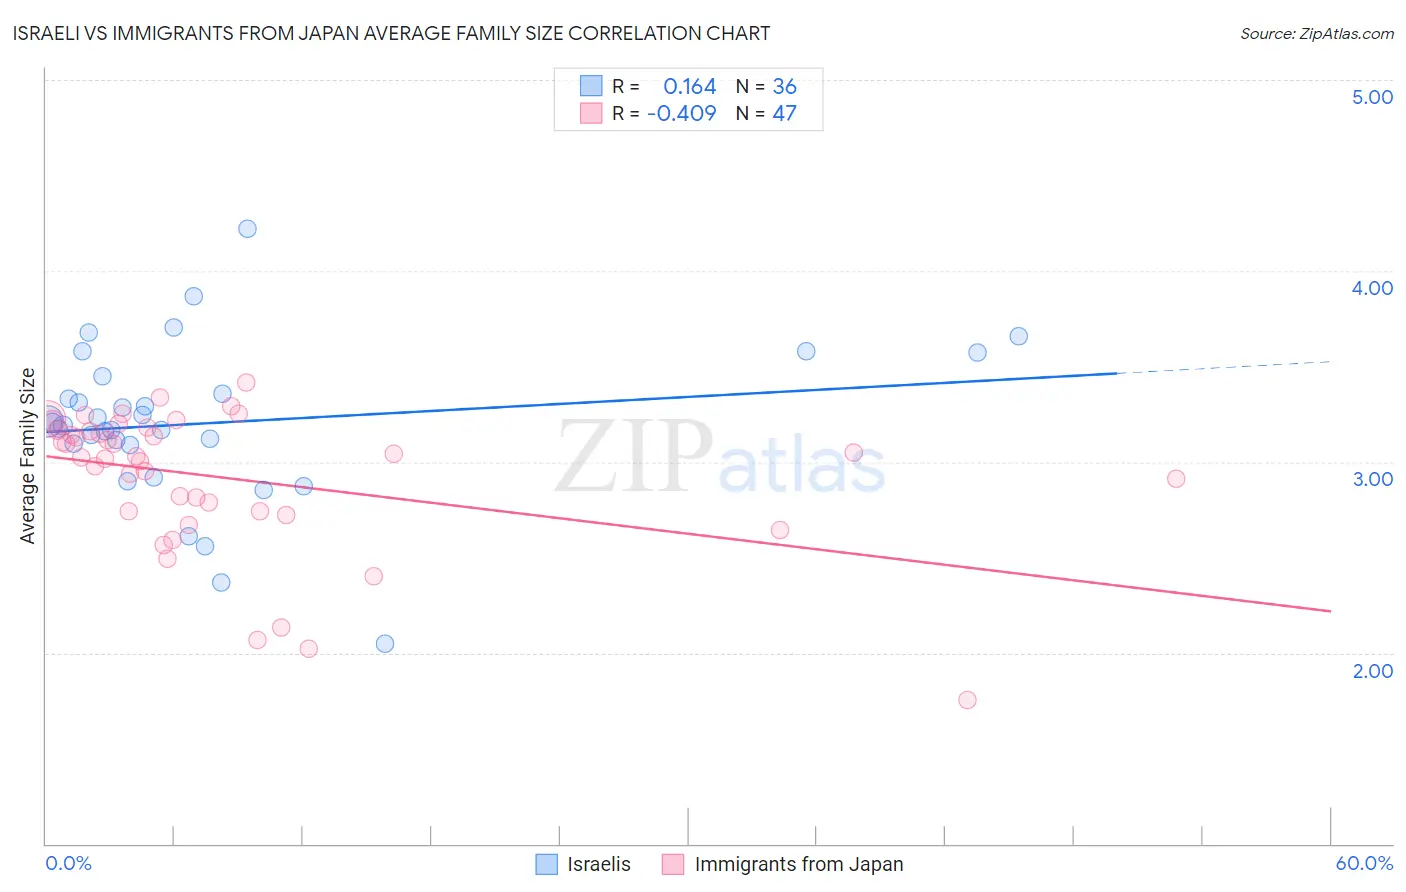
Israeli vs Immigrants from Japan Average Family Size Correlation Chart
The statistical analysis conducted on geographies consisting of 211,000,006 people shows a poor positive correlation between the proportion of Israelis and average family size in the United States with a correlation coefficient (R) of 0.164 and weighted average of 3.23. Similarly, the statistical analysis conducted on geographies consisting of 339,992,819 people shows a moderate negative correlation between the proportion of Immigrants from Japan and average family size in the United States with a correlation coefficient (R) of -0.409 and weighted average of 3.18, a difference of 1.6%.
Average Family Size Correlation Summary
| Measurement | Israeli | Immigrants from Japan |
| Minimum | 2.05 | 1.75 |
| Maximum | 4.22 | 3.42 |
| Range | 2.17 | 1.67 |
| Mean | 3.20 | 2.92 |
| Median | 3.20 | 3.03 |
| Interquartile 25% (IQ1) | 3.09 | 2.74 |
| Interquartile 75% (IQ3) | 3.40 | 3.17 |
| Interquartile Range (IQR) | 0.31 | 0.43 |
| Standard Deviation (Sample) | 0.41 | 0.37 |
| Standard Deviation (Population) | 0.41 | 0.37 |
Similar Demographics by Average Family Size
Demographics Similar to Israelis by Average Family Size
In terms of average family size, the demographic groups most similar to Israelis are Immigrants from South Central Asia (3.23, a difference of 0.020%), Immigrants from China (3.23, a difference of 0.020%), Argentinean (3.23, a difference of 0.020%), Spaniard (3.23, a difference of 0.030%), and Immigrants from Korea (3.23, a difference of 0.030%).
| Demographics | Rating | Rank | Average Family Size |
| Aleuts | 54.1 /100 | #169 | Average 3.23 |
| Arabs | 53.8 /100 | #170 | Average 3.23 |
| Chileans | 53.2 /100 | #171 | Average 3.23 |
| Immigrants | Congo | 52.7 /100 | #172 | Average 3.23 |
| Immigrants | Uruguay | 52.0 /100 | #173 | Average 3.23 |
| Immigrants | South Central Asia | 50.0 /100 | #174 | Average 3.23 |
| Immigrants | China | 49.9 /100 | #175 | Average 3.23 |
| Israelis | 48.7 /100 | #176 | Average 3.23 |
| Argentineans | 47.4 /100 | #177 | Average 3.23 |
| Spaniards | 47.2 /100 | #178 | Average 3.23 |
| Immigrants | Korea | 46.9 /100 | #179 | Average 3.23 |
| Palestinians | 46.6 /100 | #180 | Average 3.23 |
| Spanish | 44.8 /100 | #181 | Average 3.23 |
| Moroccans | 44.2 /100 | #182 | Average 3.22 |
| Immigrants | Northern Africa | 41.7 /100 | #183 | Average 3.22 |
Demographics Similar to Immigrants from Japan by Average Family Size
In terms of average family size, the demographic groups most similar to Immigrants from Japan are Osage (3.18, a difference of 0.020%), Hungarian (3.18, a difference of 0.020%), Immigrants from Moldova (3.18, a difference of 0.020%), Immigrants from Southern Europe (3.18, a difference of 0.030%), and Houma (3.18, a difference of 0.050%).
| Demographics | Rating | Rank | Average Family Size |
| Iranians | 4.5 /100 | #234 | Tragic 3.18 |
| Immigrants | Turkey | 4.2 /100 | #235 | Tragic 3.18 |
| Immigrants | Portugal | 4.2 /100 | #236 | Tragic 3.18 |
| Immigrants | Romania | 3.7 /100 | #237 | Tragic 3.18 |
| Romanians | 3.7 /100 | #238 | Tragic 3.18 |
| Houma | 3.4 /100 | #239 | Tragic 3.18 |
| Osage | 3.2 /100 | #240 | Tragic 3.18 |
| Immigrants | Japan | 3.0 /100 | #241 | Tragic 3.18 |
| Hungarians | 3.0 /100 | #242 | Tragic 3.18 |
| Immigrants | Moldova | 2.9 /100 | #243 | Tragic 3.18 |
| Immigrants | Southern Europe | 2.9 /100 | #244 | Tragic 3.18 |
| Immigrants | Brazil | 2.7 /100 | #245 | Tragic 3.18 |
| Danes | 2.5 /100 | #246 | Tragic 3.17 |
| Cajuns | 2.4 /100 | #247 | Tragic 3.17 |
| Immigrants | Belarus | 2.3 /100 | #248 | Tragic 3.17 |