Guyanese vs Immigrants from Romania Single Mother Households
COMPARE
Guyanese
Immigrants from Romania
Single Mother Households
Single Mother Households Comparison
Guyanese
Immigrants from Romania
7.6%
SINGLE MOTHER HOUSEHOLDS
0.1/ 100
METRIC RATING
276th/ 347
METRIC RANK
5.5%
SINGLE MOTHER HOUSEHOLDS
99.0/ 100
METRIC RATING
56th/ 347
METRIC RANK
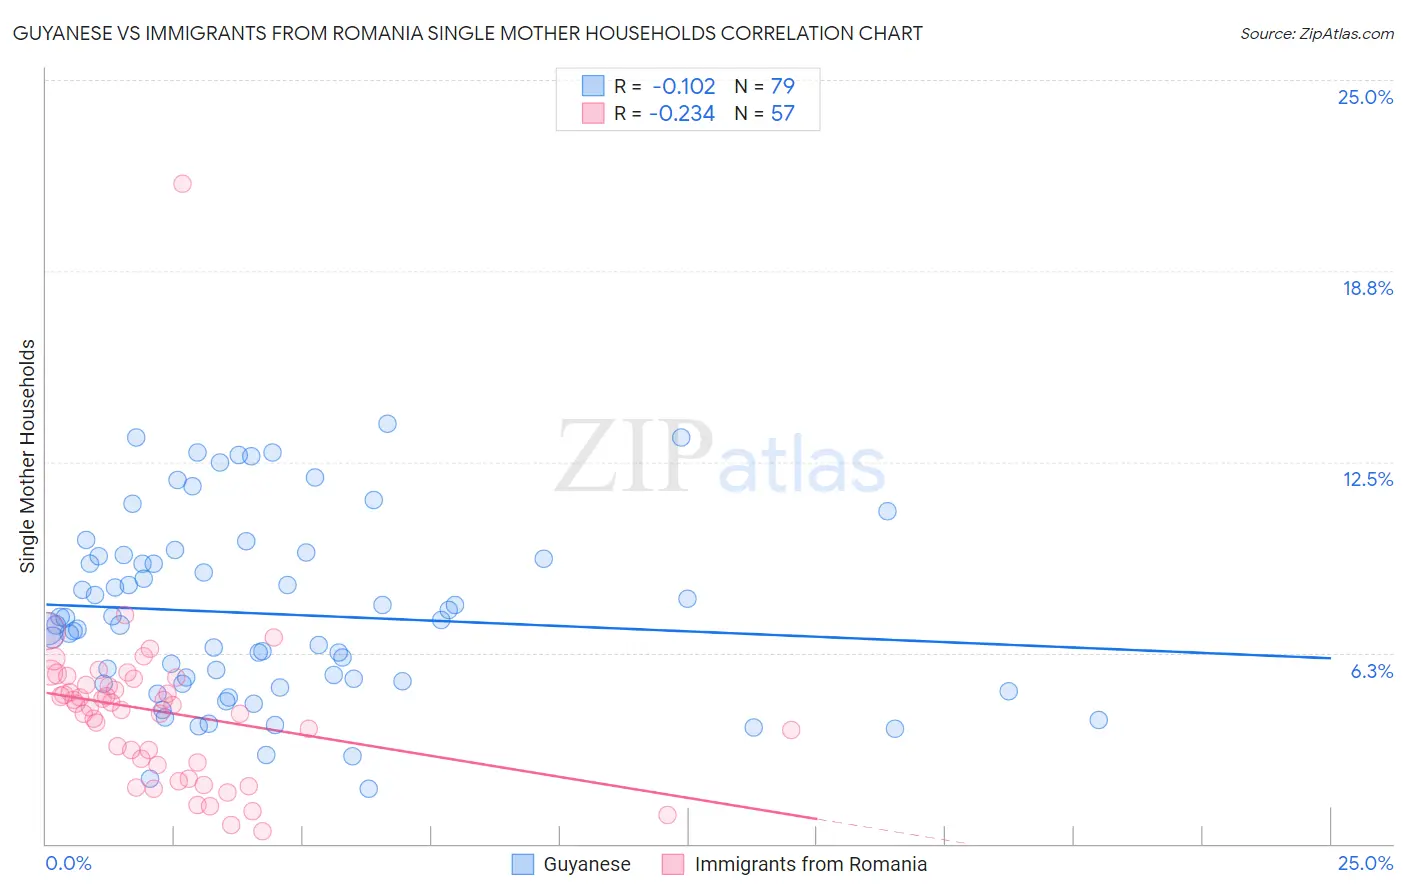
Guyanese vs Immigrants from Romania Single Mother Households Correlation Chart
The statistical analysis conducted on geographies consisting of 176,625,838 people shows a poor negative correlation between the proportion of Guyanese and percentage of single mother households in the United States with a correlation coefficient (R) of -0.102 and weighted average of 7.6%. Similarly, the statistical analysis conducted on geographies consisting of 256,535,689 people shows a weak negative correlation between the proportion of Immigrants from Romania and percentage of single mother households in the United States with a correlation coefficient (R) of -0.234 and weighted average of 5.5%, a difference of 37.9%.
Single Mother Households Correlation Summary
| Measurement | Guyanese | Immigrants from Romania |
| Minimum | 1.8% | 0.41% |
| Maximum | 13.7% | 21.6% |
| Range | 11.9% | 21.2% |
| Mean | 7.5% | 4.3% |
| Median | 7.2% | 4.6% |
| Interquartile 25% (IQ1) | 5.3% | 2.6% |
| Interquartile 75% (IQ3) | 9.4% | 5.3% |
| Interquartile Range (IQR) | 4.1% | 2.7% |
| Standard Deviation (Sample) | 2.9% | 2.9% |
| Standard Deviation (Population) | 2.9% | 2.9% |
Similar Demographics by Single Mother Households
Demographics Similar to Guyanese by Single Mother Households
In terms of single mother households, the demographic groups most similar to Guyanese are Immigrants from Trinidad and Tobago (7.6%, a difference of 0.040%), Central American (7.6%, a difference of 0.050%), Immigrants from El Salvador (7.6%, a difference of 0.27%), Central American Indian (7.6%, a difference of 0.45%), and Immigrants from Guyana (7.6%, a difference of 0.55%).
| Demographics | Rating | Rank | Single Mother Households |
| Somalis | 0.1 /100 | #269 | Tragic 7.5% |
| Immigrants | Cuba | 0.1 /100 | #270 | Tragic 7.5% |
| Salvadorans | 0.1 /100 | #271 | Tragic 7.5% |
| Immigrants | Azores | 0.1 /100 | #272 | Tragic 7.5% |
| Belizeans | 0.1 /100 | #273 | Tragic 7.6% |
| Immigrants | Guyana | 0.1 /100 | #274 | Tragic 7.6% |
| Central American Indians | 0.1 /100 | #275 | Tragic 7.6% |
| Guyanese | 0.1 /100 | #276 | Tragic 7.6% |
| Immigrants | Trinidad and Tobago | 0.1 /100 | #277 | Tragic 7.6% |
| Central Americans | 0.1 /100 | #278 | Tragic 7.6% |
| Immigrants | El Salvador | 0.0 /100 | #279 | Tragic 7.6% |
| Immigrants | Sierra Leone | 0.0 /100 | #280 | Tragic 7.7% |
| Immigrants | Laos | 0.0 /100 | #281 | Tragic 7.7% |
| Guatemalans | 0.0 /100 | #282 | Tragic 7.7% |
| Nigerians | 0.0 /100 | #283 | Tragic 7.7% |
Demographics Similar to Immigrants from Romania by Single Mother Households
In terms of single mother households, the demographic groups most similar to Immigrants from Romania are Immigrants from Denmark (5.5%, a difference of 0.070%), Immigrants from Europe (5.5%, a difference of 0.080%), Immigrants from Lebanon (5.5%, a difference of 0.24%), Immigrants from Russia (5.5%, a difference of 0.26%), and Danish (5.5%, a difference of 0.32%).
| Demographics | Rating | Rank | Single Mother Households |
| Immigrants | Latvia | 99.2 /100 | #49 | Exceptional 5.5% |
| Immigrants | Scotland | 99.2 /100 | #50 | Exceptional 5.5% |
| Immigrants | Belarus | 99.2 /100 | #51 | Exceptional 5.5% |
| Swedes | 99.1 /100 | #52 | Exceptional 5.5% |
| Immigrants | Russia | 99.1 /100 | #53 | Exceptional 5.5% |
| Immigrants | Lebanon | 99.1 /100 | #54 | Exceptional 5.5% |
| Immigrants | Denmark | 99.1 /100 | #55 | Exceptional 5.5% |
| Immigrants | Romania | 99.0 /100 | #56 | Exceptional 5.5% |
| Immigrants | Europe | 99.0 /100 | #57 | Exceptional 5.5% |
| Danes | 98.9 /100 | #58 | Exceptional 5.5% |
| Luxembourgers | 98.7 /100 | #59 | Exceptional 5.6% |
| Immigrants | Norway | 98.7 /100 | #60 | Exceptional 5.6% |
| Australians | 98.7 /100 | #61 | Exceptional 5.6% |
| Poles | 98.6 /100 | #62 | Exceptional 5.6% |
| Immigrants | North Macedonia | 98.6 /100 | #63 | Exceptional 5.6% |