Albanian vs American Family Households with Children
COMPARE
Albanian
American
Family Households with Children
Family Households with Children Comparison
Albanians
Americans
26.5%
FAMILY HOUSEHOLDS WITH CHILDREN
0.2/ 100
METRIC RATING
290th/ 347
METRIC RANK
27.3%
FAMILY HOUSEHOLDS WITH CHILDREN
22.8/ 100
METRIC RATING
202nd/ 347
METRIC RANK
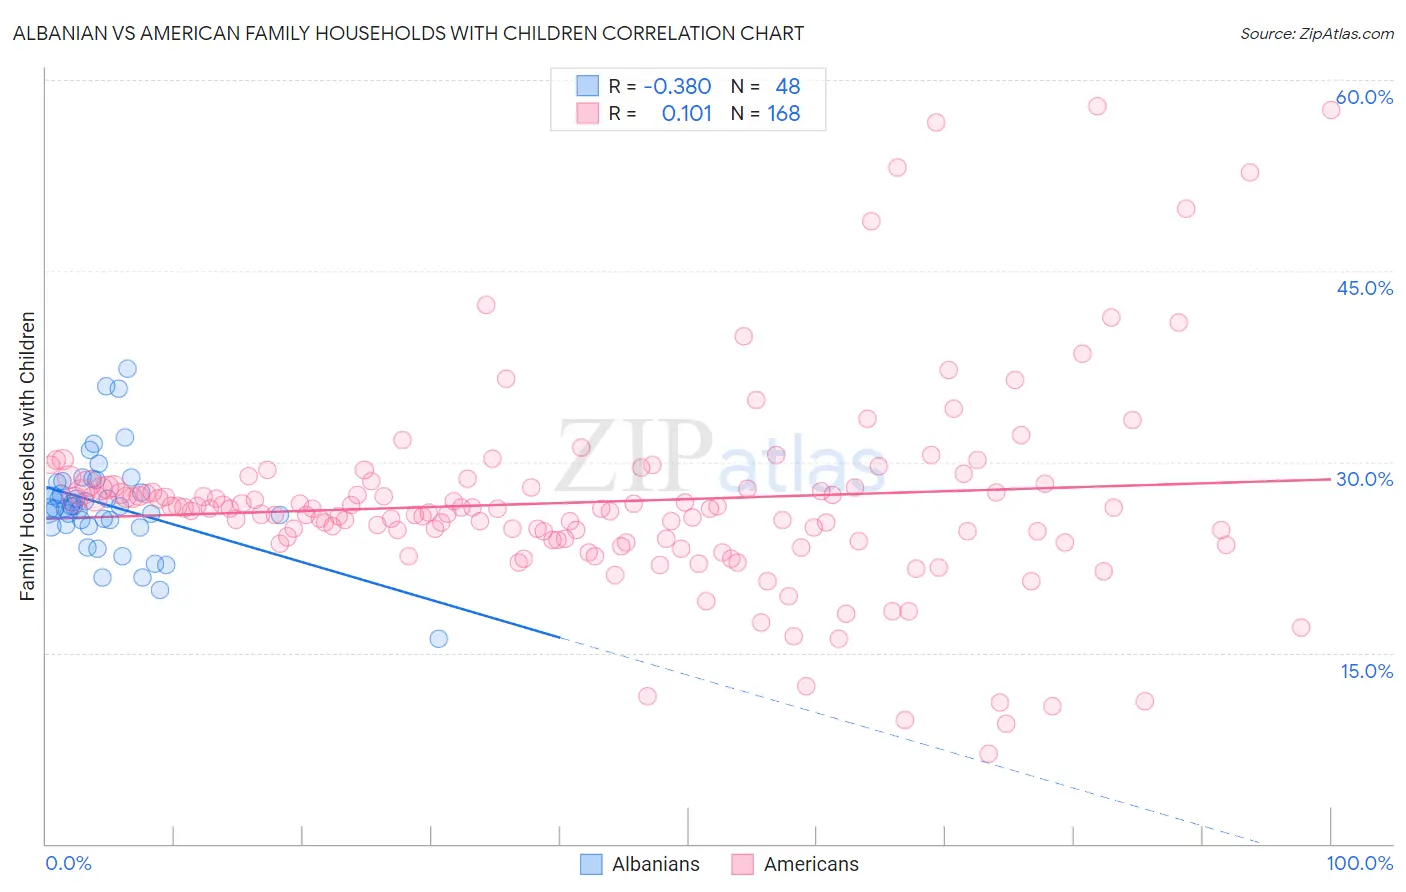
Albanian vs American Family Households with Children Correlation Chart
The statistical analysis conducted on geographies consisting of 193,166,642 people shows a mild negative correlation between the proportion of Albanians and percentage of family households with children in the United States with a correlation coefficient (R) of -0.380 and weighted average of 26.5%. Similarly, the statistical analysis conducted on geographies consisting of 580,876,887 people shows a poor positive correlation between the proportion of Americans and percentage of family households with children in the United States with a correlation coefficient (R) of 0.101 and weighted average of 27.3%, a difference of 3.0%.
Family Households with Children Correlation Summary
| Measurement | Albanian | American |
| Minimum | 16.1% | 7.1% |
| Maximum | 37.3% | 57.9% |
| Range | 21.2% | 50.8% |
| Mean | 26.6% | 26.9% |
| Median | 26.5% | 26.3% |
| Interquartile 25% (IQ1) | 25.0% | 23.8% |
| Interquartile 75% (IQ3) | 28.4% | 28.0% |
| Interquartile Range (IQR) | 3.4% | 4.2% |
| Standard Deviation (Sample) | 3.9% | 7.9% |
| Standard Deviation (Population) | 3.8% | 7.9% |
Similar Demographics by Family Households with Children
Demographics Similar to Albanians by Family Households with Children
In terms of family households with children, the demographic groups most similar to Albanians are Bahamian (26.5%, a difference of 0.010%), Polish (26.5%, a difference of 0.010%), Black/African American (26.5%, a difference of 0.060%), Immigrants from Sweden (26.5%, a difference of 0.11%), and Latvian (26.4%, a difference of 0.12%).
| Demographics | Rating | Rank | Family Households with Children |
| Immigrants | North America | 0.3 /100 | #283 | Tragic 26.6% |
| Immigrants | Canada | 0.3 /100 | #284 | Tragic 26.5% |
| Cambodians | 0.2 /100 | #285 | Tragic 26.5% |
| Immigrants | Senegal | 0.2 /100 | #286 | Tragic 26.5% |
| Shoshone | 0.2 /100 | #287 | Tragic 26.5% |
| Russians | 0.2 /100 | #288 | Tragic 26.5% |
| Immigrants | Sweden | 0.2 /100 | #289 | Tragic 26.5% |
| Albanians | 0.2 /100 | #290 | Tragic 26.5% |
| Bahamians | 0.2 /100 | #291 | Tragic 26.5% |
| Poles | 0.2 /100 | #292 | Tragic 26.5% |
| Blacks/African Americans | 0.1 /100 | #293 | Tragic 26.5% |
| Latvians | 0.1 /100 | #294 | Tragic 26.4% |
| Macedonians | 0.1 /100 | #295 | Tragic 26.4% |
| Croatians | 0.1 /100 | #296 | Tragic 26.4% |
| Armenians | 0.1 /100 | #297 | Tragic 26.4% |
Demographics Similar to Americans by Family Households with Children
In terms of family households with children, the demographic groups most similar to Americans are Kiowa (27.3%, a difference of 0.020%), Immigrants from Sudan (27.3%, a difference of 0.040%), Bhutanese (27.3%, a difference of 0.070%), Immigrants from Haiti (27.2%, a difference of 0.080%), and Immigrants from Micronesia (27.2%, a difference of 0.090%).
| Demographics | Rating | Rank | Family Households with Children |
| Crow | 35.7 /100 | #195 | Fair 27.4% |
| Cheyenne | 35.1 /100 | #196 | Fair 27.4% |
| Norwegians | 35.0 /100 | #197 | Fair 27.4% |
| Immigrants | Romania | 34.4 /100 | #198 | Fair 27.4% |
| English | 32.0 /100 | #199 | Fair 27.3% |
| Immigrants | Congo | 28.7 /100 | #200 | Fair 27.3% |
| Bhutanese | 25.1 /100 | #201 | Fair 27.3% |
| Americans | 22.8 /100 | #202 | Fair 27.3% |
| Kiowa | 22.2 /100 | #203 | Fair 27.3% |
| Immigrants | Sudan | 21.6 /100 | #204 | Fair 27.3% |
| Immigrants | Haiti | 20.3 /100 | #205 | Fair 27.2% |
| Immigrants | Micronesia | 20.2 /100 | #206 | Fair 27.2% |
| Haitians | 19.8 /100 | #207 | Poor 27.2% |
| Immigrants | Poland | 16.4 /100 | #208 | Poor 27.2% |
| Dutch West Indians | 15.8 /100 | #209 | Poor 27.2% |