Immigrants from Malaysia vs Assyrian/Chaldean/Syriac Family Households with Children
COMPARE
Immigrants from Malaysia
Assyrian/Chaldean/Syriac
Family Households with Children
Family Households with Children Comparison
Immigrants from Malaysia
Assyrians/Chaldeans/Syriacs
27.9%
FAMILY HOUSEHOLDS WITH CHILDREN
95.9/ 100
METRIC RATING
117th/ 347
METRIC RANK
28.1%
FAMILY HOUSEHOLDS WITH CHILDREN
98.7/ 100
METRIC RATING
102nd/ 347
METRIC RANK
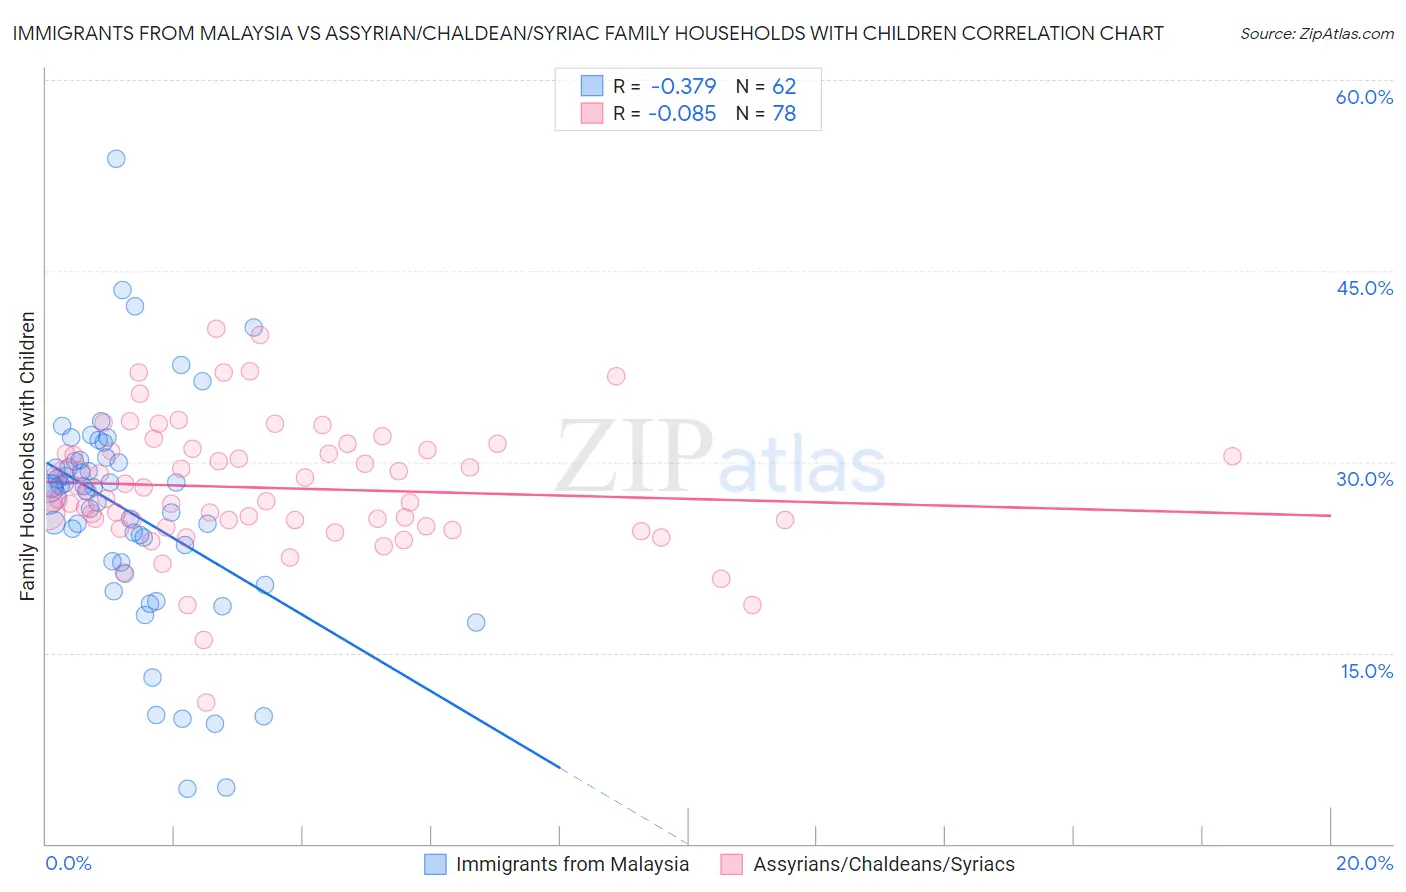
Immigrants from Malaysia vs Assyrian/Chaldean/Syriac Family Households with Children Correlation Chart
The statistical analysis conducted on geographies consisting of 197,900,652 people shows a mild negative correlation between the proportion of Immigrants from Malaysia and percentage of family households with children in the United States with a correlation coefficient (R) of -0.379 and weighted average of 27.9%. Similarly, the statistical analysis conducted on geographies consisting of 110,282,118 people shows a slight negative correlation between the proportion of Assyrians/Chaldeans/Syriacs and percentage of family households with children in the United States with a correlation coefficient (R) of -0.085 and weighted average of 28.1%, a difference of 0.64%.
Family Households with Children Correlation Summary
| Measurement | Immigrants from Malaysia | Assyrian/Chaldean/Syriac |
| Minimum | 4.3% | 11.1% |
| Maximum | 53.8% | 40.5% |
| Range | 49.5% | 29.4% |
| Mean | 26.1% | 28.0% |
| Median | 27.8% | 27.4% |
| Interquartile 25% (IQ1) | 22.1% | 25.4% |
| Interquartile 75% (IQ3) | 30.1% | 30.8% |
| Interquartile Range (IQR) | 8.0% | 5.4% |
| Standard Deviation (Sample) | 8.9% | 5.0% |
| Standard Deviation (Population) | 8.8% | 5.0% |
Demographics Similar to Immigrants from Malaysia and Assyrians/Chaldeans/Syriacs by Family Households with Children
In terms of family households with children, the demographic groups most similar to Immigrants from Malaysia are Central American Indian (27.9%, a difference of 0.0%), Pakistani (27.9%, a difference of 0.010%), Zimbabwean (27.9%, a difference of 0.040%), South American Indian (28.0%, a difference of 0.14%), and Immigrants from Africa (28.0%, a difference of 0.14%). Similarly, the demographic groups most similar to Assyrians/Chaldeans/Syriacs are Immigrants from Oceania (28.1%, a difference of 0.030%), Immigrants from the Azores (28.1%, a difference of 0.050%), Indonesian (28.1%, a difference of 0.050%), Palestinian (28.1%, a difference of 0.10%), and Sioux (28.1%, a difference of 0.15%).
| Demographics | Rating | Rank | Family Households with Children |
| Immigrants | Azores | 98.8 /100 | #99 | Exceptional 28.1% |
| Indonesians | 98.8 /100 | #100 | Exceptional 28.1% |
| Immigrants | Oceania | 98.8 /100 | #101 | Exceptional 28.1% |
| Assyrians/Chaldeans/Syriacs | 98.7 /100 | #102 | Exceptional 28.1% |
| Palestinians | 98.5 /100 | #103 | Exceptional 28.1% |
| Sioux | 98.3 /100 | #104 | Exceptional 28.1% |
| Choctaw | 98.3 /100 | #105 | Exceptional 28.1% |
| Immigrants | South America | 98.0 /100 | #106 | Exceptional 28.0% |
| Immigrants | Uganda | 97.7 /100 | #107 | Exceptional 28.0% |
| Immigrants | Burma/Myanmar | 97.7 /100 | #108 | Exceptional 28.0% |
| Tohono O'odham | 97.6 /100 | #109 | Exceptional 28.0% |
| Spaniards | 97.4 /100 | #110 | Exceptional 28.0% |
| Scandinavians | 97.1 /100 | #111 | Exceptional 28.0% |
| Immigrants | Middle Africa | 97.0 /100 | #112 | Exceptional 28.0% |
| Arabs | 97.0 /100 | #113 | Exceptional 28.0% |
| South American Indians | 96.9 /100 | #114 | Exceptional 28.0% |
| Immigrants | Africa | 96.8 /100 | #115 | Exceptional 28.0% |
| Pakistanis | 96.0 /100 | #116 | Exceptional 27.9% |
| Immigrants | Malaysia | 95.9 /100 | #117 | Exceptional 27.9% |
| Central American Indians | 95.9 /100 | #118 | Exceptional 27.9% |
| Zimbabweans | 95.6 /100 | #119 | Exceptional 27.9% |