Indonesian vs Immigrants from Peru Currently Married
COMPARE
Indonesian
Immigrants from Peru
Currently Married
Currently Married Comparison
Indonesians
Immigrants from Peru
43.5%
CURRENTLY MARRIED
0.1/ 100
METRIC RATING
272nd/ 347
METRIC RANK
46.4%
CURRENTLY MARRIED
35.3/ 100
METRIC RATING
187th/ 347
METRIC RANK
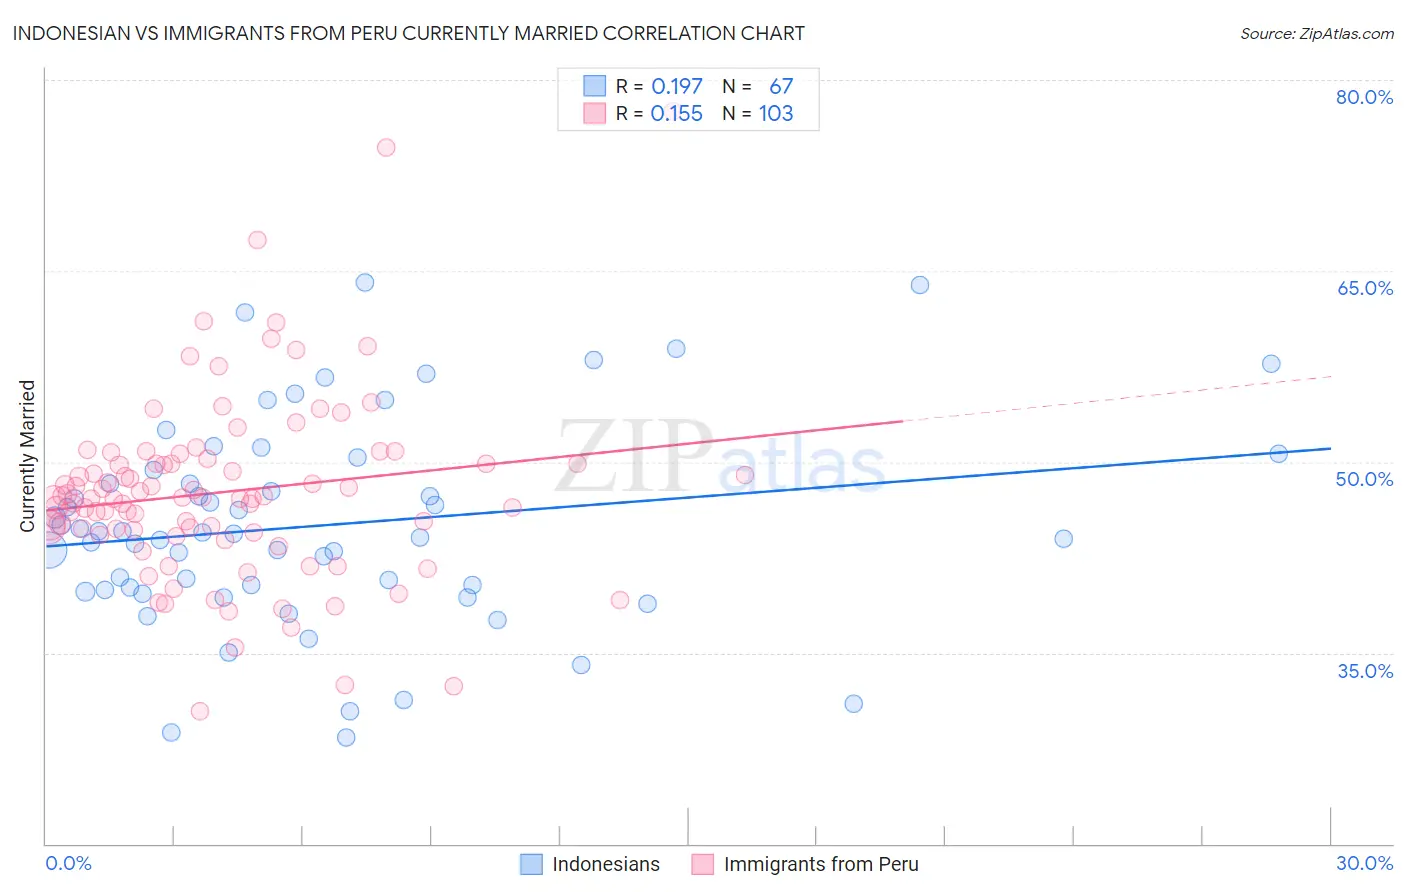
Indonesian vs Immigrants from Peru Currently Married Correlation Chart
The statistical analysis conducted on geographies consisting of 162,724,785 people shows a poor positive correlation between the proportion of Indonesians and percentage of population currently married in the United States with a correlation coefficient (R) of 0.197 and weighted average of 43.5%. Similarly, the statistical analysis conducted on geographies consisting of 328,847,084 people shows a poor positive correlation between the proportion of Immigrants from Peru and percentage of population currently married in the United States with a correlation coefficient (R) of 0.155 and weighted average of 46.4%, a difference of 6.7%.
Currently Married Correlation Summary
| Measurement | Indonesian | Immigrants from Peru |
| Minimum | 28.3% | 30.4% |
| Maximum | 64.1% | 77.5% |
| Range | 35.8% | 47.1% |
| Mean | 45.0% | 47.6% |
| Median | 44.3% | 47.2% |
| Interquartile 25% (IQ1) | 39.9% | 44.5% |
| Interquartile 75% (IQ3) | 49.4% | 49.9% |
| Interquartile Range (IQR) | 9.4% | 5.4% |
| Standard Deviation (Sample) | 8.1% | 7.3% |
| Standard Deviation (Population) | 8.0% | 7.3% |
Similar Demographics by Currently Married
Demographics Similar to Indonesians by Currently Married
In terms of currently married, the demographic groups most similar to Indonesians are Bermudan (43.5%, a difference of 0.040%), Yaqui (43.4%, a difference of 0.040%), Salvadoran (43.5%, a difference of 0.050%), Nigerian (43.4%, a difference of 0.060%), and Colville (43.4%, a difference of 0.080%).
| Demographics | Rating | Rank | Currently Married |
| Immigrants | Bangladesh | 0.1 /100 | #265 | Tragic 43.6% |
| Ecuadorians | 0.1 /100 | #266 | Tragic 43.6% |
| Immigrants | Eritrea | 0.1 /100 | #267 | Tragic 43.6% |
| Spanish American Indians | 0.1 /100 | #268 | Tragic 43.6% |
| Immigrants | Sudan | 0.1 /100 | #269 | Tragic 43.5% |
| Salvadorans | 0.1 /100 | #270 | Tragic 43.5% |
| Bermudans | 0.1 /100 | #271 | Tragic 43.5% |
| Indonesians | 0.1 /100 | #272 | Tragic 43.5% |
| Yaqui | 0.1 /100 | #273 | Tragic 43.4% |
| Nigerians | 0.1 /100 | #274 | Tragic 43.4% |
| Colville | 0.1 /100 | #275 | Tragic 43.4% |
| Sierra Leoneans | 0.1 /100 | #276 | Tragic 43.4% |
| Immigrants | Nigeria | 0.1 /100 | #277 | Tragic 43.4% |
| Central Americans | 0.0 /100 | #278 | Tragic 43.3% |
| Central American Indians | 0.0 /100 | #279 | Tragic 43.3% |
Demographics Similar to Immigrants from Peru by Currently Married
In terms of currently married, the demographic groups most similar to Immigrants from Peru are Immigrants from Chile (46.4%, a difference of 0.060%), Mongolian (46.4%, a difference of 0.090%), Colombian (46.3%, a difference of 0.14%), Brazilian (46.4%, a difference of 0.16%), and Immigrants from Northern Africa (46.5%, a difference of 0.17%).
| Demographics | Rating | Rank | Currently Married |
| Costa Ricans | 43.7 /100 | #180 | Average 46.5% |
| Ottawa | 43.0 /100 | #181 | Average 46.5% |
| Potawatomi | 41.9 /100 | #182 | Average 46.5% |
| Immigrants | Northern Africa | 39.7 /100 | #183 | Fair 46.5% |
| Brazilians | 39.3 /100 | #184 | Fair 46.4% |
| Mongolians | 37.6 /100 | #185 | Fair 46.4% |
| Immigrants | Chile | 36.8 /100 | #186 | Fair 46.4% |
| Immigrants | Peru | 35.3 /100 | #187 | Fair 46.4% |
| Colombians | 31.8 /100 | #188 | Fair 46.3% |
| Fijians | 30.3 /100 | #189 | Fair 46.3% |
| Choctaw | 29.1 /100 | #190 | Fair 46.3% |
| Immigrants | France | 27.7 /100 | #191 | Fair 46.2% |
| Soviet Union | 25.7 /100 | #192 | Fair 46.2% |
| Immigrants | Fiji | 25.0 /100 | #193 | Fair 46.2% |
| South Americans | 23.8 /100 | #194 | Fair 46.1% |