Indian (Asian) vs Croatian Single Mother Households
COMPARE
Indian (Asian)
Croatian
Single Mother Households
Single Mother Households Comparison
Indians (Asian)
Croatians
5.1%
SINGLE MOTHER HOUSEHOLDS
99.9/ 100
METRIC RATING
16th/ 347
METRIC RANK
5.5%
SINGLE MOTHER HOUSEHOLDS
99.3/ 100
METRIC RATING
46th/ 347
METRIC RANK
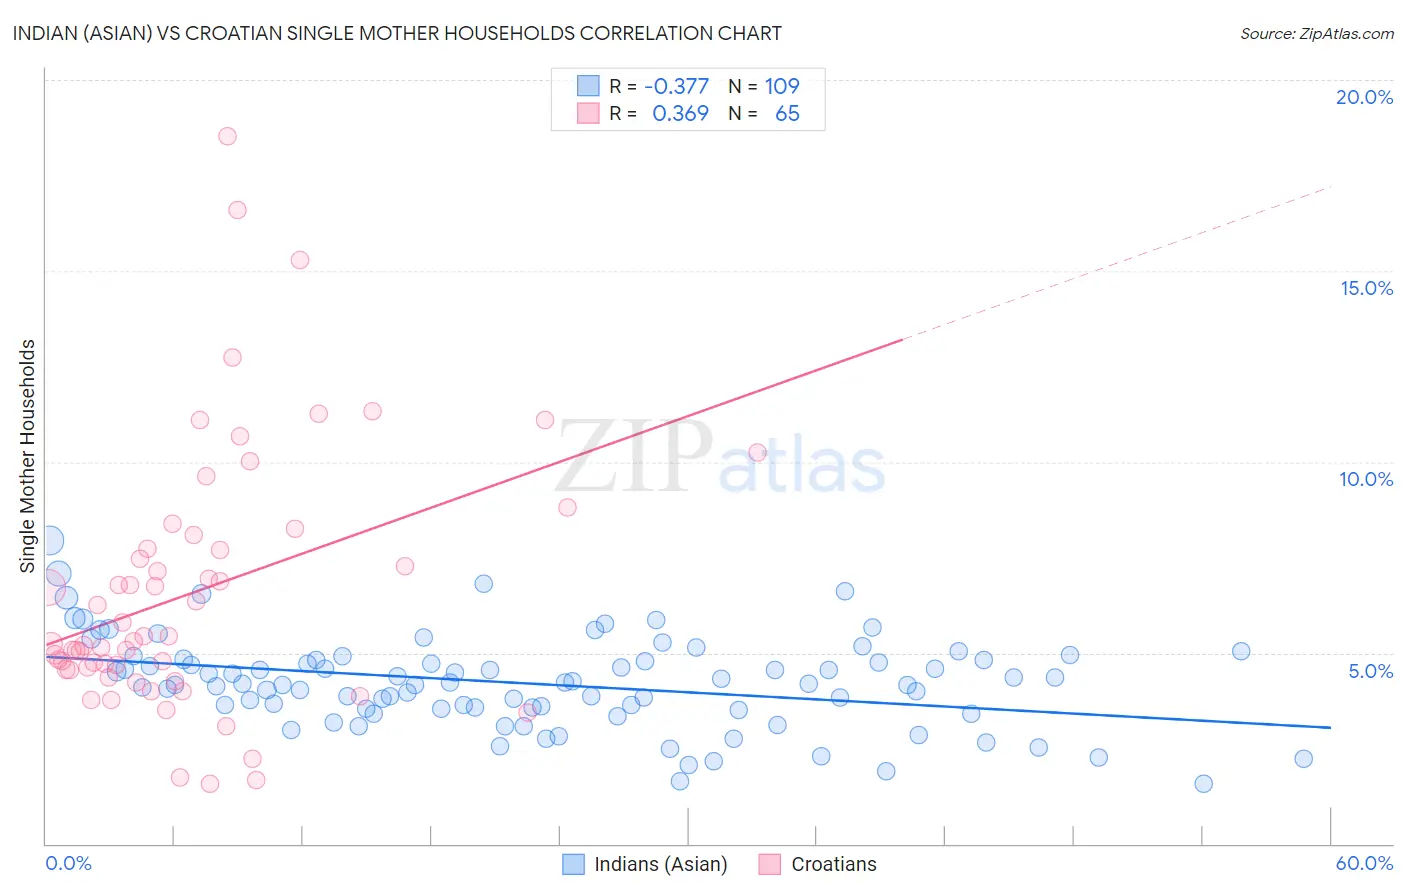
Indian (Asian) vs Croatian Single Mother Households Correlation Chart
The statistical analysis conducted on geographies consisting of 492,899,997 people shows a mild negative correlation between the proportion of Indians (Asian) and percentage of single mother households in the United States with a correlation coefficient (R) of -0.377 and weighted average of 5.1%. Similarly, the statistical analysis conducted on geographies consisting of 374,465,881 people shows a mild positive correlation between the proportion of Croatians and percentage of single mother households in the United States with a correlation coefficient (R) of 0.369 and weighted average of 5.5%, a difference of 6.8%.
Single Mother Households Correlation Summary
| Measurement | Indian (Asian) | Croatian |
| Minimum | 1.6% | 1.6% |
| Maximum | 7.9% | 18.5% |
| Range | 6.4% | 16.9% |
| Mean | 4.2% | 6.6% |
| Median | 4.2% | 5.3% |
| Interquartile 25% (IQ1) | 3.5% | 4.6% |
| Interquartile 75% (IQ3) | 4.8% | 7.9% |
| Interquartile Range (IQR) | 1.3% | 3.4% |
| Standard Deviation (Sample) | 1.2% | 3.4% |
| Standard Deviation (Population) | 1.2% | 3.4% |
Similar Demographics by Single Mother Households
Demographics Similar to Indians (Asian) by Single Mother Households
In terms of single mother households, the demographic groups most similar to Indians (Asian) are Immigrants from Eastern Asia (5.1%, a difference of 0.19%), Soviet Union (5.1%, a difference of 0.21%), Immigrants from Australia (5.1%, a difference of 0.28%), Immigrants from India (5.1%, a difference of 0.60%), and Cypriot (5.1%, a difference of 0.73%).
| Demographics | Rating | Rank | Single Mother Households |
| Okinawans | 99.9 /100 | #9 | Exceptional 5.0% |
| Immigrants | Israel | 99.9 /100 | #10 | Exceptional 5.0% |
| Immigrants | China | 99.9 /100 | #11 | Exceptional 5.1% |
| Cypriots | 99.9 /100 | #12 | Exceptional 5.1% |
| Immigrants | India | 99.9 /100 | #13 | Exceptional 5.1% |
| Immigrants | Australia | 99.9 /100 | #14 | Exceptional 5.1% |
| Immigrants | Eastern Asia | 99.9 /100 | #15 | Exceptional 5.1% |
| Indians (Asian) | 99.9 /100 | #16 | Exceptional 5.1% |
| Soviet Union | 99.9 /100 | #17 | Exceptional 5.1% |
| Immigrants | Armenia | 99.9 /100 | #18 | Exceptional 5.2% |
| Chinese | 99.9 /100 | #19 | Exceptional 5.2% |
| Maltese | 99.9 /100 | #20 | Exceptional 5.2% |
| Eastern Europeans | 99.8 /100 | #21 | Exceptional 5.2% |
| Thais | 99.8 /100 | #22 | Exceptional 5.2% |
| Immigrants | Austria | 99.8 /100 | #23 | Exceptional 5.2% |
Demographics Similar to Croatians by Single Mother Households
In terms of single mother households, the demographic groups most similar to Croatians are Norwegian (5.5%, a difference of 0.18%), Immigrants from Croatia (5.4%, a difference of 0.26%), Lithuanian (5.4%, a difference of 0.38%), Turkish (5.5%, a difference of 0.38%), and Immigrants from Latvia (5.5%, a difference of 0.41%).
| Demographics | Rating | Rank | Single Mother Households |
| Immigrants | Sweden | 99.6 /100 | #39 | Exceptional 5.4% |
| Estonians | 99.6 /100 | #40 | Exceptional 5.4% |
| Immigrants | Greece | 99.5 /100 | #41 | Exceptional 5.4% |
| Macedonians | 99.5 /100 | #42 | Exceptional 5.4% |
| Immigrants | South Central Asia | 99.5 /100 | #43 | Exceptional 5.4% |
| Lithuanians | 99.4 /100 | #44 | Exceptional 5.4% |
| Immigrants | Croatia | 99.4 /100 | #45 | Exceptional 5.4% |
| Croatians | 99.3 /100 | #46 | Exceptional 5.5% |
| Norwegians | 99.3 /100 | #47 | Exceptional 5.5% |
| Turks | 99.2 /100 | #48 | Exceptional 5.5% |
| Immigrants | Latvia | 99.2 /100 | #49 | Exceptional 5.5% |
| Immigrants | Scotland | 99.2 /100 | #50 | Exceptional 5.5% |
| Immigrants | Belarus | 99.2 /100 | #51 | Exceptional 5.5% |
| Swedes | 99.1 /100 | #52 | Exceptional 5.5% |
| Immigrants | Russia | 99.1 /100 | #53 | Exceptional 5.5% |