Indian (Asian) vs Icelander Family Households with Children
COMPARE
Indian (Asian)
Icelander
Family Households with Children
Family Households with Children Comparison
Indians (Asian)
Icelanders
27.6%
FAMILY HOUSEHOLDS WITH CHILDREN
71.6/ 100
METRIC RATING
157th/ 347
METRIC RANK
27.6%
FAMILY HOUSEHOLDS WITH CHILDREN
75.3/ 100
METRIC RATING
154th/ 347
METRIC RANK
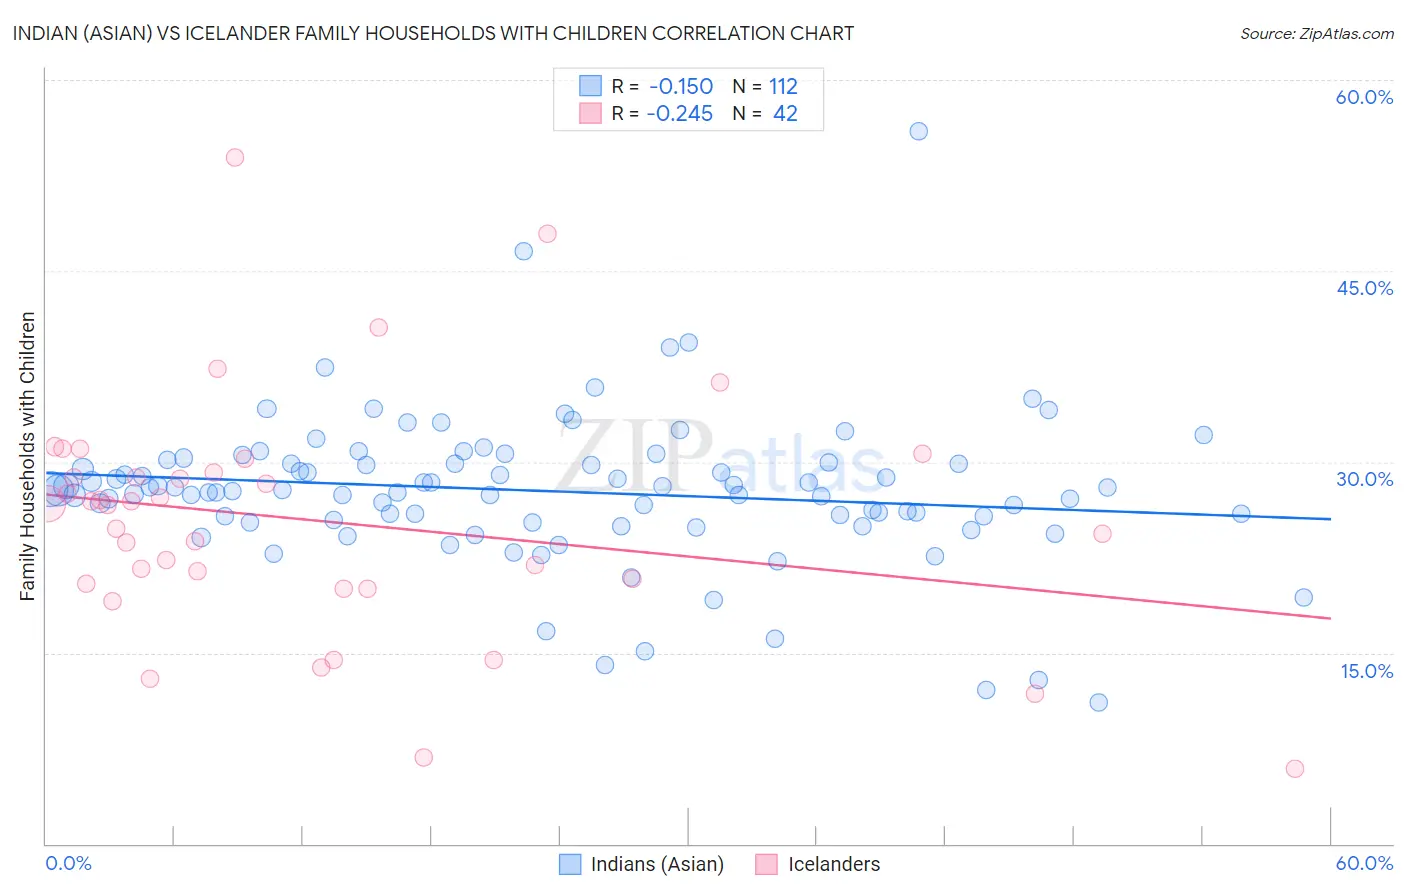
Indian (Asian) vs Icelander Family Households with Children Correlation Chart
The statistical analysis conducted on geographies consisting of 494,524,246 people shows a poor negative correlation between the proportion of Indians (Asian) and percentage of family households with children in the United States with a correlation coefficient (R) of -0.150 and weighted average of 27.6%. Similarly, the statistical analysis conducted on geographies consisting of 159,563,345 people shows a weak negative correlation between the proportion of Icelanders and percentage of family households with children in the United States with a correlation coefficient (R) of -0.245 and weighted average of 27.6%, a difference of 0.10%.
Family Households with Children Correlation Summary
| Measurement | Indian (Asian) | Icelander |
| Minimum | 11.1% | 5.9% |
| Maximum | 55.9% | 53.9% |
| Range | 44.9% | 48.1% |
| Mean | 27.7% | 25.4% |
| Median | 27.8% | 26.7% |
| Interquartile 25% (IQ1) | 25.6% | 20.4% |
| Interquartile 75% (IQ3) | 29.9% | 29.1% |
| Interquartile Range (IQR) | 4.3% | 8.7% |
| Standard Deviation (Sample) | 5.9% | 9.5% |
| Standard Deviation (Population) | 5.9% | 9.4% |
Demographics Similar to Indians (Asian) and Icelanders by Family Households with Children
In terms of family households with children, the demographic groups most similar to Indians (Asian) are Romanian (27.6%, a difference of 0.020%), Mongolian (27.6%, a difference of 0.020%), Hungarian (27.6%, a difference of 0.080%), Comanche (27.6%, a difference of 0.090%), and Immigrants from Cabo Verde (27.6%, a difference of 0.11%). Similarly, the demographic groups most similar to Icelanders are Immigrants from Cabo Verde (27.6%, a difference of 0.010%), Comanche (27.6%, a difference of 0.010%), Hungarian (27.6%, a difference of 0.020%), Ethiopian (27.6%, a difference of 0.050%), and Portuguese (27.6%, a difference of 0.080%).
| Demographics | Rating | Rank | Family Households with Children |
| Immigrants | Chile | 79.5 /100 | #145 | Good 27.7% |
| Basques | 79.5 /100 | #146 | Good 27.7% |
| Immigrants | Moldova | 79.1 /100 | #147 | Good 27.6% |
| Osage | 79.0 /100 | #148 | Good 27.6% |
| Menominee | 78.9 /100 | #149 | Good 27.6% |
| Argentineans | 78.5 /100 | #150 | Good 27.6% |
| Portuguese | 77.8 /100 | #151 | Good 27.6% |
| Ethiopians | 77.0 /100 | #152 | Good 27.6% |
| Immigrants | Cabo Verde | 75.6 /100 | #153 | Good 27.6% |
| Icelanders | 75.3 /100 | #154 | Good 27.6% |
| Comanche | 74.8 /100 | #155 | Good 27.6% |
| Hungarians | 74.6 /100 | #156 | Good 27.6% |
| Indians (Asian) | 71.6 /100 | #157 | Good 27.6% |
| Romanians | 70.8 /100 | #158 | Good 27.6% |
| Mongolians | 70.7 /100 | #159 | Good 27.6% |
| Sub-Saharan Africans | 67.5 /100 | #160 | Good 27.6% |
| Alaskan Athabascans | 67.1 /100 | #161 | Good 27.6% |
| Immigrants | Bangladesh | 67.0 /100 | #162 | Good 27.6% |
| Czechs | 65.3 /100 | #163 | Good 27.5% |
| Immigrants | Hong Kong | 64.9 /100 | #164 | Good 27.5% |
| Immigrants | South Africa | 61.3 /100 | #165 | Good 27.5% |