Immigrants vs Swiss Family Households with Children
COMPARE
Immigrants
Swiss
Family Households with Children
Family Households with Children Comparison
Immigrants
Swiss
28.9%
FAMILY HOUSEHOLDS WITH CHILDREN
100.0/ 100
METRIC RATING
50th/ 347
METRIC RANK
27.7%
FAMILY HOUSEHOLDS WITH CHILDREN
81.4/ 100
METRIC RATING
142nd/ 347
METRIC RANK
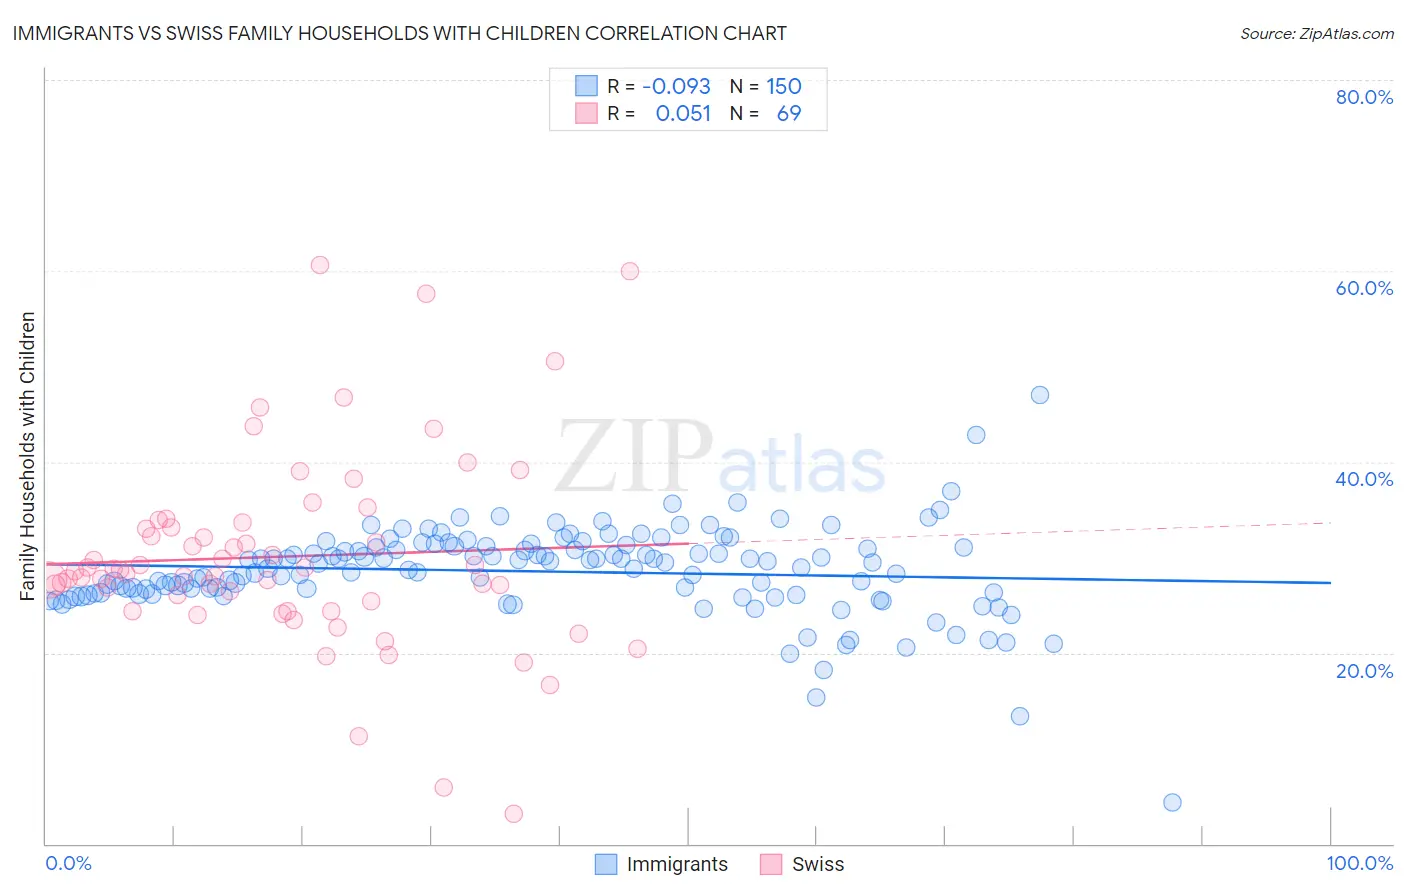
Immigrants vs Swiss Family Households with Children Correlation Chart
The statistical analysis conducted on geographies consisting of 576,631,040 people shows a slight negative correlation between the proportion of Immigrants and percentage of family households with children in the United States with a correlation coefficient (R) of -0.093 and weighted average of 28.9%. Similarly, the statistical analysis conducted on geographies consisting of 464,540,276 people shows a slight positive correlation between the proportion of Swiss and percentage of family households with children in the United States with a correlation coefficient (R) of 0.051 and weighted average of 27.7%, a difference of 4.5%.
Family Households with Children Correlation Summary
| Measurement | Immigrants | Swiss |
| Minimum | 4.3% | 3.1% |
| Maximum | 47.1% | 60.6% |
| Range | 42.7% | 57.5% |
| Mean | 28.5% | 30.1% |
| Median | 29.1% | 28.5% |
| Interquartile 25% (IQ1) | 26.2% | 24.9% |
| Interquartile 75% (IQ3) | 31.0% | 33.4% |
| Interquartile Range (IQR) | 4.8% | 8.6% |
| Standard Deviation (Sample) | 4.7% | 10.3% |
| Standard Deviation (Population) | 4.7% | 10.2% |
Similar Demographics by Family Households with Children
Demographics Similar to Immigrants by Family Households with Children
In terms of family households with children, the demographic groups most similar to Immigrants are Immigrants from Peru (28.9%, a difference of 0.040%), Jordanian (29.0%, a difference of 0.11%), Guatemalan (28.9%, a difference of 0.11%), Immigrants from Cambodia (28.9%, a difference of 0.19%), and Apache (29.0%, a difference of 0.20%).
| Demographics | Rating | Rank | Family Households with Children |
| Asians | 100.0 /100 | #43 | Exceptional 29.1% |
| Immigrants | Taiwan | 100.0 /100 | #44 | Exceptional 29.0% |
| Fijians | 100.0 /100 | #45 | Exceptional 29.0% |
| Immigrants | Philippines | 100.0 /100 | #46 | Exceptional 29.0% |
| Peruvians | 100.0 /100 | #47 | Exceptional 29.0% |
| Apache | 100.0 /100 | #48 | Exceptional 29.0% |
| Jordanians | 100.0 /100 | #49 | Exceptional 29.0% |
| Immigrants | Immigrants | 100.0 /100 | #50 | Exceptional 28.9% |
| Immigrants | Peru | 100.0 /100 | #51 | Exceptional 28.9% |
| Guatemalans | 100.0 /100 | #52 | Exceptional 28.9% |
| Immigrants | Cambodia | 100.0 /100 | #53 | Exceptional 28.9% |
| Sierra Leoneans | 100.0 /100 | #54 | Exceptional 28.9% |
| Immigrants | Asia | 100.0 /100 | #55 | Exceptional 28.8% |
| Immigrants | Guatemala | 100.0 /100 | #56 | Exceptional 28.8% |
| Danes | 100.0 /100 | #57 | Exceptional 28.7% |
Demographics Similar to Swiss by Family Households with Children
In terms of family households with children, the demographic groups most similar to Swiss are Immigrants from Eastern Asia (27.7%, a difference of 0.010%), Spanish (27.7%, a difference of 0.020%), Vietnamese (27.7%, a difference of 0.040%), Immigrants from Eastern Africa (27.7%, a difference of 0.040%), and Brazilian (27.7%, a difference of 0.060%).
| Demographics | Rating | Rank | Family Households with Children |
| Immigrants | Ecuador | 84.6 /100 | #135 | Excellent 27.7% |
| Immigrants | Portugal | 84.1 /100 | #136 | Excellent 27.7% |
| Immigrants | Dominican Republic | 83.9 /100 | #137 | Excellent 27.7% |
| Uruguayans | 83.2 /100 | #138 | Excellent 27.7% |
| Vietnamese | 82.6 /100 | #139 | Excellent 27.7% |
| Spanish | 81.8 /100 | #140 | Excellent 27.7% |
| Immigrants | Eastern Asia | 81.7 /100 | #141 | Excellent 27.7% |
| Swiss | 81.4 /100 | #142 | Excellent 27.7% |
| Immigrants | Eastern Africa | 80.2 /100 | #143 | Excellent 27.7% |
| Brazilians | 79.6 /100 | #144 | Good 27.7% |
| Immigrants | Chile | 79.5 /100 | #145 | Good 27.7% |
| Basques | 79.5 /100 | #146 | Good 27.7% |
| Immigrants | Moldova | 79.1 /100 | #147 | Good 27.6% |
| Osage | 79.0 /100 | #148 | Good 27.6% |
| Menominee | 78.9 /100 | #149 | Good 27.6% |