Immigrants vs Immigrants from Japan Family Households with Children
COMPARE
Immigrants
Immigrants from Japan
Family Households with Children
Family Households with Children Comparison
Immigrants
Immigrants from Japan
28.9%
FAMILY HOUSEHOLDS WITH CHILDREN
100.0/ 100
METRIC RATING
50th/ 347
METRIC RANK
27.1%
FAMILY HOUSEHOLDS WITH CHILDREN
10.7/ 100
METRIC RATING
219th/ 347
METRIC RANK
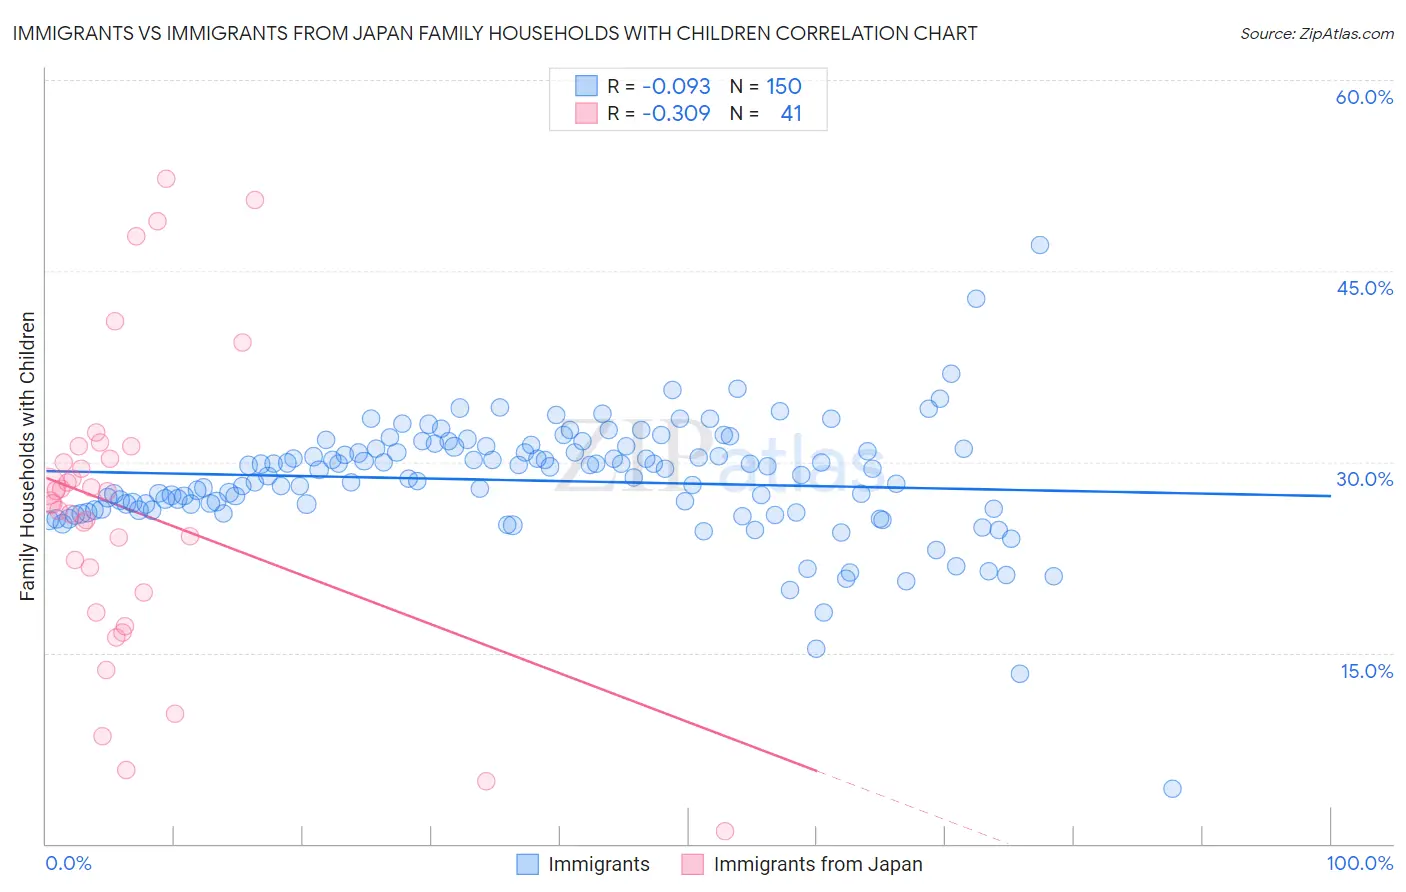
Immigrants vs Immigrants from Japan Family Households with Children Correlation Chart
The statistical analysis conducted on geographies consisting of 576,631,040 people shows a slight negative correlation between the proportion of Immigrants and percentage of family households with children in the United States with a correlation coefficient (R) of -0.093 and weighted average of 28.9%. Similarly, the statistical analysis conducted on geographies consisting of 339,902,345 people shows a mild negative correlation between the proportion of Immigrants from Japan and percentage of family households with children in the United States with a correlation coefficient (R) of -0.309 and weighted average of 27.1%, a difference of 6.7%.
Family Households with Children Correlation Summary
| Measurement | Immigrants | Immigrants from Japan |
| Minimum | 4.3% | 1.0% |
| Maximum | 47.1% | 52.3% |
| Range | 42.7% | 51.3% |
| Mean | 28.5% | 26.2% |
| Median | 29.1% | 26.8% |
| Interquartile 25% (IQ1) | 26.2% | 19.0% |
| Interquartile 75% (IQ3) | 31.0% | 30.7% |
| Interquartile Range (IQR) | 4.8% | 11.7% |
| Standard Deviation (Sample) | 4.7% | 11.7% |
| Standard Deviation (Population) | 4.7% | 11.6% |
Similar Demographics by Family Households with Children
Demographics Similar to Immigrants by Family Households with Children
In terms of family households with children, the demographic groups most similar to Immigrants are Immigrants from Peru (28.9%, a difference of 0.040%), Jordanian (29.0%, a difference of 0.11%), Guatemalan (28.9%, a difference of 0.11%), Immigrants from Cambodia (28.9%, a difference of 0.19%), and Apache (29.0%, a difference of 0.20%).
| Demographics | Rating | Rank | Family Households with Children |
| Asians | 100.0 /100 | #43 | Exceptional 29.1% |
| Immigrants | Taiwan | 100.0 /100 | #44 | Exceptional 29.0% |
| Fijians | 100.0 /100 | #45 | Exceptional 29.0% |
| Immigrants | Philippines | 100.0 /100 | #46 | Exceptional 29.0% |
| Peruvians | 100.0 /100 | #47 | Exceptional 29.0% |
| Apache | 100.0 /100 | #48 | Exceptional 29.0% |
| Jordanians | 100.0 /100 | #49 | Exceptional 29.0% |
| Immigrants | Immigrants | 100.0 /100 | #50 | Exceptional 28.9% |
| Immigrants | Peru | 100.0 /100 | #51 | Exceptional 28.9% |
| Guatemalans | 100.0 /100 | #52 | Exceptional 28.9% |
| Immigrants | Cambodia | 100.0 /100 | #53 | Exceptional 28.9% |
| Sierra Leoneans | 100.0 /100 | #54 | Exceptional 28.9% |
| Immigrants | Asia | 100.0 /100 | #55 | Exceptional 28.8% |
| Immigrants | Guatemala | 100.0 /100 | #56 | Exceptional 28.8% |
| Danes | 100.0 /100 | #57 | Exceptional 28.7% |
Demographics Similar to Immigrants from Japan by Family Households with Children
In terms of family households with children, the demographic groups most similar to Immigrants from Japan are Greek (27.1%, a difference of 0.040%), Austrian (27.1%, a difference of 0.050%), New Zealander (27.1%, a difference of 0.070%), Cuban (27.1%, a difference of 0.080%), and U.S. Virgin Islander (27.1%, a difference of 0.080%).
| Demographics | Rating | Rank | Family Households with Children |
| Immigrants | Dominica | 13.9 /100 | #212 | Poor 27.2% |
| Okinawans | 13.7 /100 | #213 | Poor 27.2% |
| Africans | 13.0 /100 | #214 | Poor 27.2% |
| Northern Europeans | 12.8 /100 | #215 | Poor 27.2% |
| Cubans | 12.2 /100 | #216 | Poor 27.1% |
| U.S. Virgin Islanders | 12.1 /100 | #217 | Poor 27.1% |
| Greeks | 11.4 /100 | #218 | Poor 27.1% |
| Immigrants | Japan | 10.7 /100 | #219 | Poor 27.1% |
| Austrians | 9.9 /100 | #220 | Tragic 27.1% |
| New Zealanders | 9.6 /100 | #221 | Tragic 27.1% |
| Paraguayans | 9.4 /100 | #222 | Tragic 27.1% |
| Pima | 9.2 /100 | #223 | Tragic 27.1% |
| Germans | 8.7 /100 | #224 | Tragic 27.1% |
| Canadians | 7.5 /100 | #225 | Tragic 27.1% |
| Czechoslovakians | 6.6 /100 | #226 | Tragic 27.0% |