Immigrants from Zimbabwe vs British Family Households with Children
COMPARE
Immigrants from Zimbabwe
British
Family Households with Children
Family Households with Children Comparison
Immigrants from Zimbabwe
British
27.8%
FAMILY HOUSEHOLDS WITH CHILDREN
92.8/ 100
METRIC RATING
122nd/ 347
METRIC RANK
27.4%
FAMILY HOUSEHOLDS WITH CHILDREN
49.9/ 100
METRIC RATING
175th/ 347
METRIC RANK
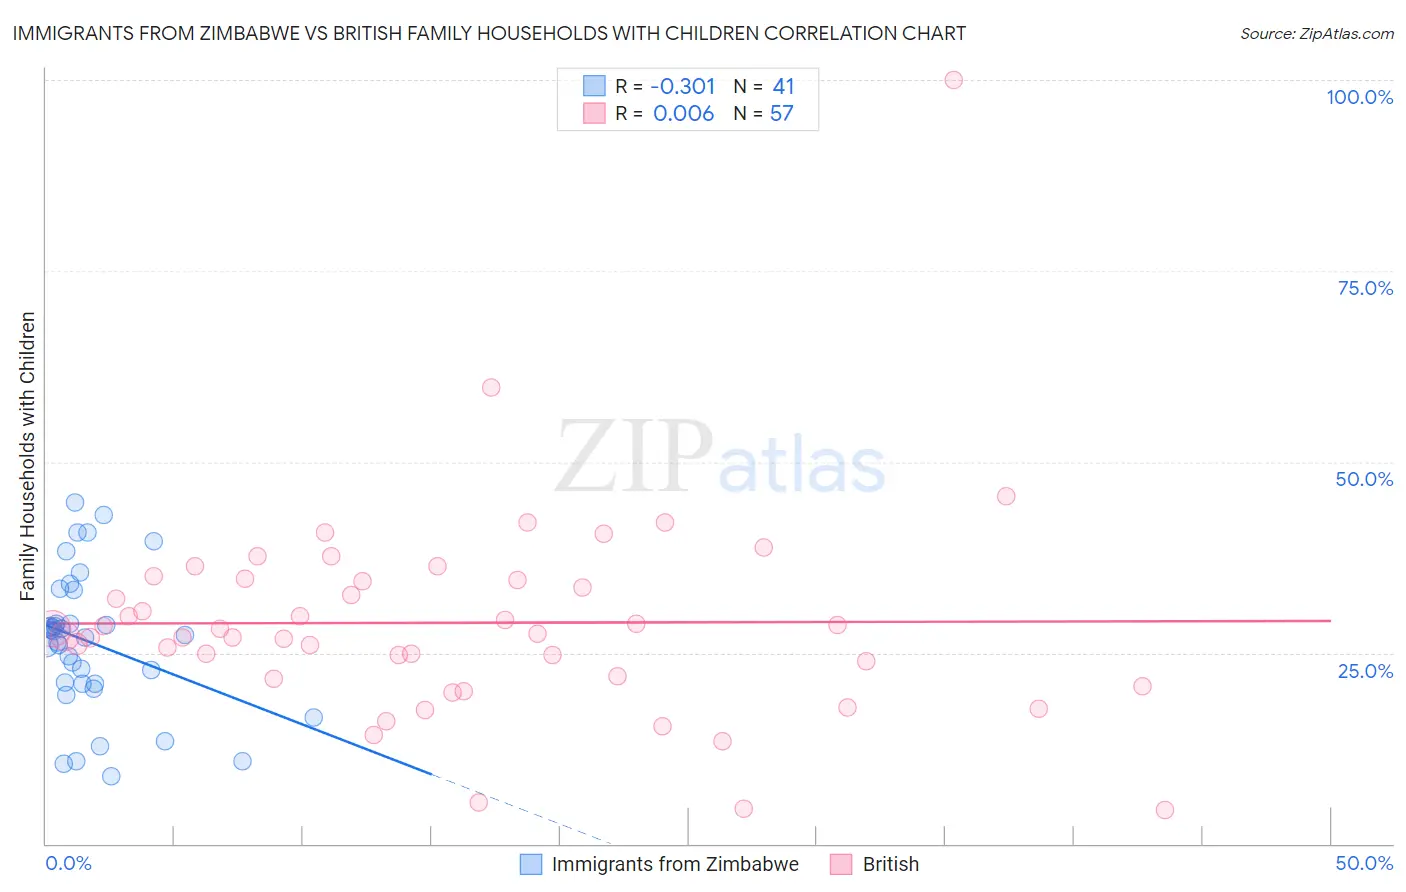
Immigrants from Zimbabwe vs British Family Households with Children Correlation Chart
The statistical analysis conducted on geographies consisting of 117,786,301 people shows a mild negative correlation between the proportion of Immigrants from Zimbabwe and percentage of family households with children in the United States with a correlation coefficient (R) of -0.301 and weighted average of 27.8%. Similarly, the statistical analysis conducted on geographies consisting of 530,729,097 people shows no correlation between the proportion of British and percentage of family households with children in the United States with a correlation coefficient (R) of 0.006 and weighted average of 27.4%, a difference of 1.4%.
Family Households with Children Correlation Summary
| Measurement | Immigrants from Zimbabwe | British |
| Minimum | 8.8% | 4.4% |
| Maximum | 44.7% | 100.0% |
| Range | 35.9% | 95.6% |
| Mean | 26.3% | 28.9% |
| Median | 27.3% | 27.6% |
| Interquartile 25% (IQ1) | 20.9% | 21.8% |
| Interquartile 75% (IQ3) | 31.0% | 34.6% |
| Interquartile Range (IQR) | 10.1% | 12.8% |
| Standard Deviation (Sample) | 9.1% | 13.9% |
| Standard Deviation (Population) | 9.0% | 13.8% |
Similar Demographics by Family Households with Children
Demographics Similar to Immigrants from Zimbabwe by Family Households with Children
In terms of family households with children, the demographic groups most similar to Immigrants from Zimbabwe are Immigrants from Western Asia (27.9%, a difference of 0.070%), Immigrants from Northern Africa (27.8%, a difference of 0.070%), Immigrants from Singapore (27.8%, a difference of 0.14%), Ecuadorian (27.8%, a difference of 0.14%), and Immigrants from Ethiopia (27.8%, a difference of 0.16%).
| Demographics | Rating | Rank | Family Households with Children |
| Immigrants | Africa | 96.8 /100 | #115 | Exceptional 28.0% |
| Pakistanis | 96.0 /100 | #116 | Exceptional 27.9% |
| Immigrants | Malaysia | 95.9 /100 | #117 | Exceptional 27.9% |
| Central American Indians | 95.9 /100 | #118 | Exceptional 27.9% |
| Zimbabweans | 95.6 /100 | #119 | Exceptional 27.9% |
| Europeans | 95.4 /100 | #120 | Exceptional 27.9% |
| Immigrants | Western Asia | 93.6 /100 | #121 | Exceptional 27.9% |
| Immigrants | Zimbabwe | 92.8 /100 | #122 | Exceptional 27.8% |
| Immigrants | Northern Africa | 91.8 /100 | #123 | Exceptional 27.8% |
| Immigrants | Singapore | 90.8 /100 | #124 | Exceptional 27.8% |
| Ecuadorians | 90.8 /100 | #125 | Exceptional 27.8% |
| Immigrants | Ethiopia | 90.5 /100 | #126 | Exceptional 27.8% |
| Belizeans | 90.0 /100 | #127 | Exceptional 27.8% |
| Syrians | 89.7 /100 | #128 | Excellent 27.8% |
| Immigrants | Eritrea | 89.4 /100 | #129 | Excellent 27.8% |
Demographics Similar to British by Family Households with Children
In terms of family households with children, the demographic groups most similar to British are White/Caucasian (27.4%, a difference of 0.0%), Immigrants from China (27.4%, a difference of 0.010%), Ugandan (27.4%, a difference of 0.020%), Spanish American (27.4%, a difference of 0.020%), and Immigrants from Argentina (27.5%, a difference of 0.050%).
| Demographics | Rating | Rank | Family Households with Children |
| Immigrants | Kuwait | 60.9 /100 | #168 | Good 27.5% |
| Seminole | 56.9 /100 | #169 | Average 27.5% |
| Cherokee | 56.7 /100 | #170 | Average 27.5% |
| Blackfeet | 54.3 /100 | #171 | Average 27.5% |
| Israelis | 53.9 /100 | #172 | Average 27.5% |
| Immigrants | Argentina | 52.2 /100 | #173 | Average 27.5% |
| Whites/Caucasians | 50.0 /100 | #174 | Average 27.4% |
| British | 49.9 /100 | #175 | Average 27.4% |
| Immigrants | China | 49.6 /100 | #176 | Average 27.4% |
| Ugandans | 49.2 /100 | #177 | Average 27.4% |
| Spanish Americans | 48.9 /100 | #178 | Average 27.4% |
| Turks | 46.9 /100 | #179 | Average 27.4% |
| Immigrants | Turkey | 46.9 /100 | #180 | Average 27.4% |
| Aleuts | 46.7 /100 | #181 | Average 27.4% |
| Puget Sound Salish | 46.2 /100 | #182 | Average 27.4% |