French vs Immigrants from Western Africa Family Households with Children
COMPARE
French
Immigrants from Western Africa
Family Households with Children
Family Households with Children Comparison
French
Immigrants from Western Africa
26.7%
FAMILY HOUSEHOLDS WITH CHILDREN
0.7/ 100
METRIC RATING
271st/ 347
METRIC RANK
28.3%
FAMILY HOUSEHOLDS WITH CHILDREN
99.6/ 100
METRIC RATING
86th/ 347
METRIC RANK
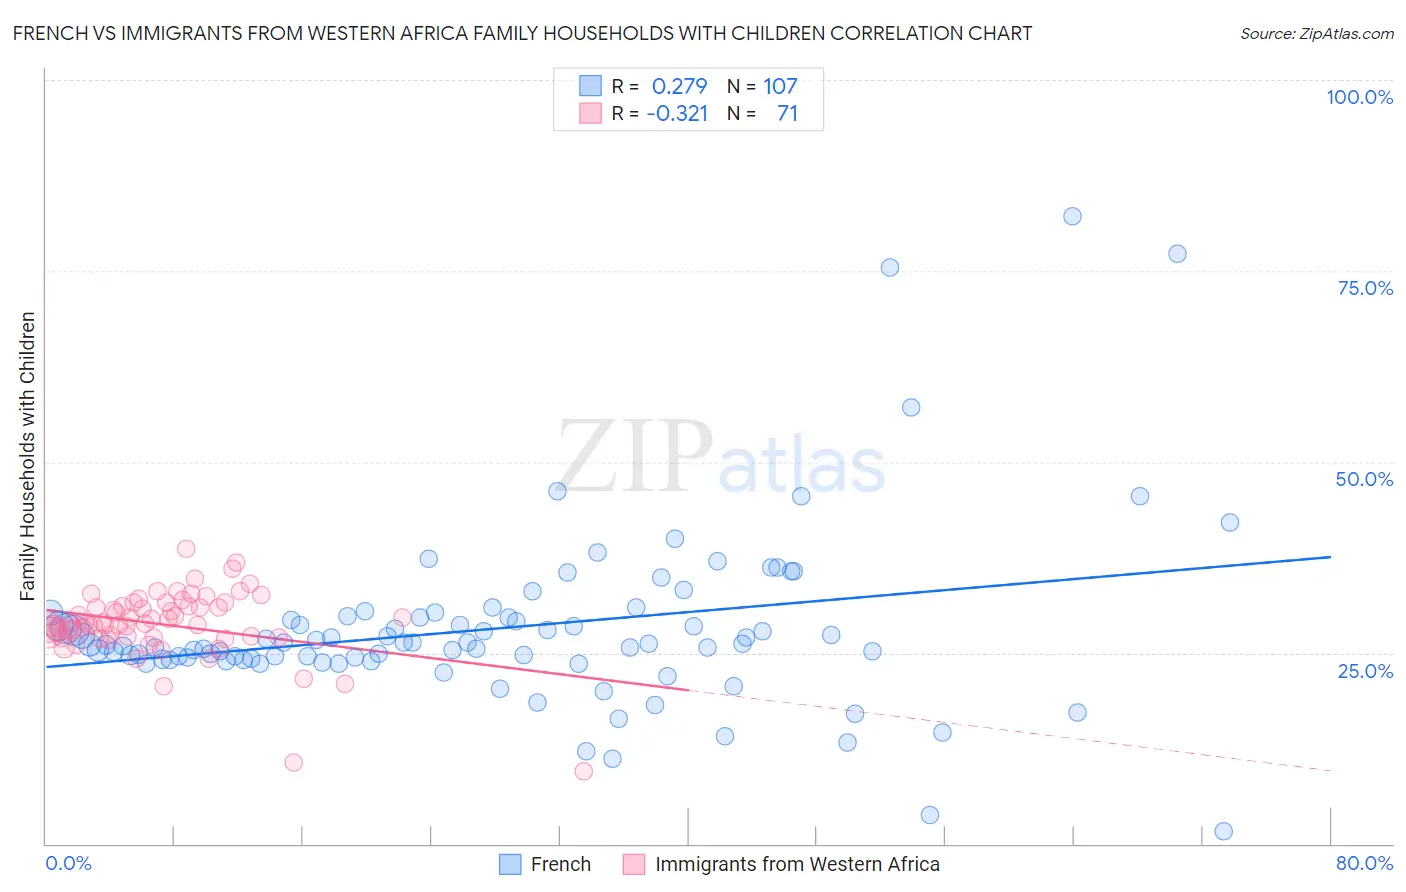
French vs Immigrants from Western Africa Family Households with Children Correlation Chart
The statistical analysis conducted on geographies consisting of 571,388,158 people shows a weak positive correlation between the proportion of French and percentage of family households with children in the United States with a correlation coefficient (R) of 0.279 and weighted average of 26.7%. Similarly, the statistical analysis conducted on geographies consisting of 357,382,055 people shows a mild negative correlation between the proportion of Immigrants from Western Africa and percentage of family households with children in the United States with a correlation coefficient (R) of -0.321 and weighted average of 28.3%, a difference of 5.9%.
Family Households with Children Correlation Summary
| Measurement | French | Immigrants from Western Africa |
| Minimum | 1.6% | 9.6% |
| Maximum | 82.1% | 38.6% |
| Range | 80.6% | 29.1% |
| Mean | 28.2% | 28.7% |
| Median | 26.1% | 28.8% |
| Interquartile 25% (IQ1) | 24.2% | 27.0% |
| Interquartile 75% (IQ3) | 29.6% | 31.1% |
| Interquartile Range (IQR) | 5.4% | 4.1% |
| Standard Deviation (Sample) | 11.5% | 4.6% |
| Standard Deviation (Population) | 11.5% | 4.6% |
Similar Demographics by Family Households with Children
Demographics Similar to French by Family Households with Children
In terms of family households with children, the demographic groups most similar to French are Immigrants from Zaire (26.7%, a difference of 0.010%), Somali (26.7%, a difference of 0.060%), Immigrants from Denmark (26.7%, a difference of 0.070%), Immigrants from Hungary (26.7%, a difference of 0.10%), and Eastern European (26.7%, a difference of 0.10%).
| Demographics | Rating | Rank | Family Households with Children |
| Taiwanese | 0.9 /100 | #264 | Tragic 26.7% |
| Chippewa | 0.9 /100 | #265 | Tragic 26.7% |
| Maltese | 0.9 /100 | #266 | Tragic 26.7% |
| Immigrants | Uzbekistan | 0.9 /100 | #267 | Tragic 26.7% |
| Immigrants | Belgium | 0.9 /100 | #268 | Tragic 26.7% |
| Immigrants | Denmark | 0.8 /100 | #269 | Tragic 26.7% |
| Immigrants | Zaire | 0.7 /100 | #270 | Tragic 26.7% |
| French | 0.7 /100 | #271 | Tragic 26.7% |
| Somalis | 0.7 /100 | #272 | Tragic 26.7% |
| Immigrants | Hungary | 0.6 /100 | #273 | Tragic 26.7% |
| Eastern Europeans | 0.6 /100 | #274 | Tragic 26.7% |
| Immigrants | Northern Europe | 0.5 /100 | #275 | Tragic 26.7% |
| Immigrants | Spain | 0.5 /100 | #276 | Tragic 26.6% |
| Celtics | 0.4 /100 | #277 | Tragic 26.6% |
| Immigrants | Europe | 0.4 /100 | #278 | Tragic 26.6% |
Demographics Similar to Immigrants from Western Africa by Family Households with Children
In terms of family households with children, the demographic groups most similar to Immigrants from Western Africa are Colombian (28.3%, a difference of 0.060%), Liberian (28.3%, a difference of 0.070%), Immigrants from Costa Rica (28.3%, a difference of 0.080%), Immigrants from Thailand (28.2%, a difference of 0.18%), and Immigrants from Liberia (28.2%, a difference of 0.23%).
| Demographics | Rating | Rank | Family Households with Children |
| Immigrants | Iraq | 99.8 /100 | #79 | Exceptional 28.4% |
| Natives/Alaskans | 99.8 /100 | #80 | Exceptional 28.4% |
| South Americans | 99.8 /100 | #81 | Exceptional 28.4% |
| Kenyans | 99.8 /100 | #82 | Exceptional 28.4% |
| Nicaraguans | 99.8 /100 | #83 | Exceptional 28.4% |
| Costa Ricans | 99.8 /100 | #84 | Exceptional 28.4% |
| Immigrants | Syria | 99.8 /100 | #85 | Exceptional 28.4% |
| Immigrants | Western Africa | 99.6 /100 | #86 | Exceptional 28.3% |
| Colombians | 99.6 /100 | #87 | Exceptional 28.3% |
| Liberians | 99.6 /100 | #88 | Exceptional 28.3% |
| Immigrants | Costa Rica | 99.6 /100 | #89 | Exceptional 28.3% |
| Immigrants | Thailand | 99.5 /100 | #90 | Exceptional 28.2% |
| Immigrants | Liberia | 99.4 /100 | #91 | Exceptional 28.2% |
| Chickasaw | 99.4 /100 | #92 | Exceptional 28.2% |
| Panamanians | 99.3 /100 | #93 | Exceptional 28.2% |