Immigrants from Western Africa vs Ecuadorian Divorced or Separated
COMPARE
Immigrants from Western Africa
Ecuadorian
Divorced or Separated
Divorced or Separated Comparison
Immigrants from Western Africa
Ecuadorians
12.3%
DIVORCED OR SEPARATED
9.3/ 100
METRIC RATING
226th/ 347
METRIC RANK
11.7%
DIVORCED OR SEPARATED
95.3/ 100
METRIC RATING
118th/ 347
METRIC RANK
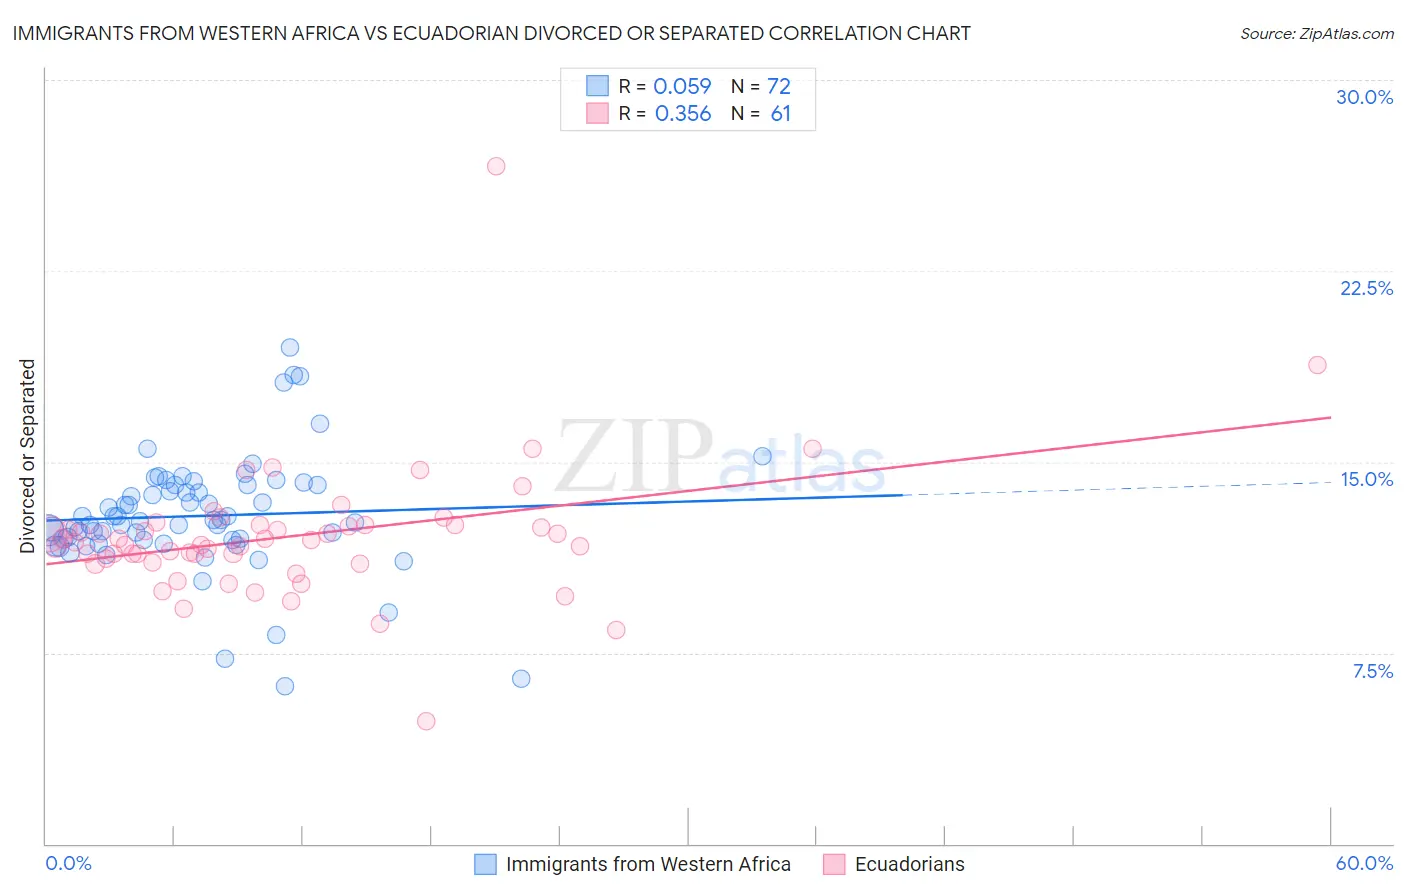
Immigrants from Western Africa vs Ecuadorian Divorced or Separated Correlation Chart
The statistical analysis conducted on geographies consisting of 357,656,491 people shows a slight positive correlation between the proportion of Immigrants from Western Africa and percentage of population currently divorced or separated in the United States with a correlation coefficient (R) of 0.059 and weighted average of 12.3%. Similarly, the statistical analysis conducted on geographies consisting of 317,712,201 people shows a mild positive correlation between the proportion of Ecuadorians and percentage of population currently divorced or separated in the United States with a correlation coefficient (R) of 0.356 and weighted average of 11.7%, a difference of 4.7%.
Divorced or Separated Correlation Summary
| Measurement | Immigrants from Western Africa | Ecuadorian |
| Minimum | 6.2% | 4.8% |
| Maximum | 19.5% | 26.6% |
| Range | 13.3% | 21.8% |
| Mean | 12.9% | 12.1% |
| Median | 12.7% | 11.8% |
| Interquartile 25% (IQ1) | 11.9% | 11.1% |
| Interquartile 75% (IQ3) | 14.1% | 12.5% |
| Interquartile Range (IQR) | 2.2% | 1.4% |
| Standard Deviation (Sample) | 2.3% | 2.7% |
| Standard Deviation (Population) | 2.3% | 2.7% |
Similar Demographics by Divorced or Separated
Demographics Similar to Immigrants from Western Africa by Divorced or Separated
In terms of divorced or separated, the demographic groups most similar to Immigrants from Western Africa are Belgian (12.3%, a difference of 0.030%), Immigrants from the Azores (12.3%, a difference of 0.040%), Hmong (12.3%, a difference of 0.050%), Scandinavian (12.3%, a difference of 0.10%), and Immigrants from Cameroon (12.3%, a difference of 0.10%).
| Demographics | Rating | Rank | Divorced or Separated |
| Czechoslovakians | 11.7 /100 | #219 | Poor 12.3% |
| British | 11.6 /100 | #220 | Poor 12.3% |
| Guamanians/Chamorros | 11.3 /100 | #221 | Poor 12.3% |
| Bangladeshis | 10.5 /100 | #222 | Poor 12.3% |
| Scandinavians | 10.4 /100 | #223 | Poor 12.3% |
| Immigrants | Azores | 9.7 /100 | #224 | Tragic 12.3% |
| Belgians | 9.7 /100 | #225 | Tragic 12.3% |
| Immigrants | Western Africa | 9.3 /100 | #226 | Tragic 12.3% |
| Hmong | 8.8 /100 | #227 | Tragic 12.3% |
| Immigrants | Cameroon | 8.3 /100 | #228 | Tragic 12.3% |
| Immigrants | Sudan | 8.2 /100 | #229 | Tragic 12.3% |
| Yakama | 7.8 /100 | #230 | Tragic 12.3% |
| Yugoslavians | 6.6 /100 | #231 | Tragic 12.3% |
| Canadians | 5.3 /100 | #232 | Tragic 12.4% |
| Malaysians | 4.8 /100 | #233 | Tragic 12.4% |
Demographics Similar to Ecuadorians by Divorced or Separated
In terms of divorced or separated, the demographic groups most similar to Ecuadorians are Immigrants from Uganda (11.7%, a difference of 0.0%), Immigrants from Iraq (11.7%, a difference of 0.020%), Syrian (11.7%, a difference of 0.040%), Lithuanian (11.7%, a difference of 0.090%), and Iraqi (11.8%, a difference of 0.13%).
| Demographics | Rating | Rank | Divorced or Separated |
| Immigrants | Spain | 96.8 /100 | #111 | Exceptional 11.7% |
| Immigrants | France | 96.6 /100 | #112 | Exceptional 11.7% |
| Estonians | 96.6 /100 | #113 | Exceptional 11.7% |
| Immigrants | Norway | 95.9 /100 | #114 | Exceptional 11.7% |
| Lithuanians | 95.7 /100 | #115 | Exceptional 11.7% |
| Immigrants | Iraq | 95.4 /100 | #116 | Exceptional 11.7% |
| Immigrants | Uganda | 95.3 /100 | #117 | Exceptional 11.7% |
| Ecuadorians | 95.3 /100 | #118 | Exceptional 11.7% |
| Syrians | 95.1 /100 | #119 | Exceptional 11.7% |
| Iraqis | 94.6 /100 | #120 | Exceptional 11.8% |
| Romanians | 94.5 /100 | #121 | Exceptional 11.8% |
| Menominee | 93.8 /100 | #122 | Exceptional 11.8% |
| Immigrants | Immigrants | 93.7 /100 | #123 | Exceptional 11.8% |
| Ugandans | 93.1 /100 | #124 | Exceptional 11.8% |
| Ukrainians | 92.3 /100 | #125 | Exceptional 11.8% |