Immigrants from Western Africa vs Blackfeet Family Households
COMPARE
Immigrants from Western Africa
Blackfeet
Family Households
Family Households Comparison
Immigrants from Western Africa
Blackfeet
63.1%
FAMILY HOUSEHOLDS
0.5/ 100
METRIC RATING
266th/ 347
METRIC RANK
63.6%
FAMILY HOUSEHOLDS
3.6/ 100
METRIC RATING
228th/ 347
METRIC RANK
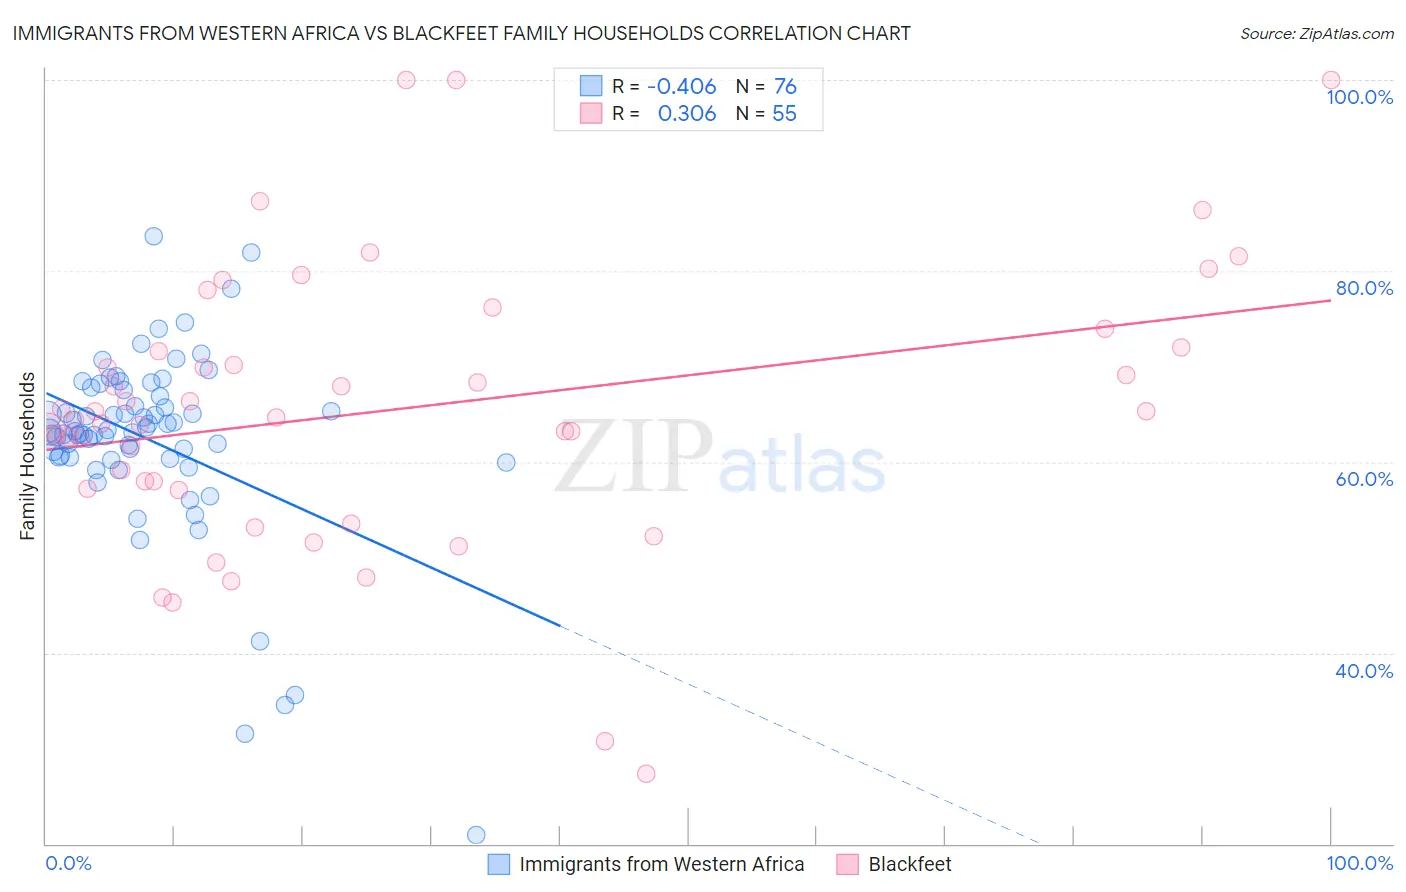
Immigrants from Western Africa vs Blackfeet Family Households Correlation Chart
The statistical analysis conducted on geographies consisting of 357,554,747 people shows a moderate negative correlation between the proportion of Immigrants from Western Africa and percentage of family households in the United States with a correlation coefficient (R) of -0.406 and weighted average of 63.1%. Similarly, the statistical analysis conducted on geographies consisting of 309,476,715 people shows a mild positive correlation between the proportion of Blackfeet and percentage of family households in the United States with a correlation coefficient (R) of 0.306 and weighted average of 63.6%, a difference of 0.70%.
Family Households Correlation Summary
| Measurement | Immigrants from Western Africa | Blackfeet |
| Minimum | 20.9% | 27.3% |
| Maximum | 83.6% | 100.0% |
| Range | 62.7% | 72.7% |
| Mean | 62.4% | 65.5% |
| Median | 63.3% | 64.6% |
| Interquartile 25% (IQ1) | 60.5% | 57.2% |
| Interquartile 75% (IQ3) | 67.2% | 72.0% |
| Interquartile Range (IQR) | 6.7% | 14.9% |
| Standard Deviation (Sample) | 9.9% | 14.7% |
| Standard Deviation (Population) | 9.8% | 14.6% |
Similar Demographics by Family Households
Demographics Similar to Immigrants from Western Africa by Family Households
In terms of family households, the demographic groups most similar to Immigrants from Western Africa are Colville (63.2%, a difference of 0.010%), Cheyenne (63.2%, a difference of 0.020%), Kenyan (63.2%, a difference of 0.020%), Israeli (63.1%, a difference of 0.040%), and Immigrants from Ireland (63.2%, a difference of 0.050%).
| Demographics | Rating | Rank | Family Households |
| Immigrants | Western Europe | 0.6 /100 | #259 | Tragic 63.2% |
| Cypriots | 0.6 /100 | #260 | Tragic 63.2% |
| Immigrants | Russia | 0.6 /100 | #261 | Tragic 63.2% |
| Immigrants | Ireland | 0.6 /100 | #262 | Tragic 63.2% |
| Cheyenne | 0.5 /100 | #263 | Tragic 63.2% |
| Kenyans | 0.5 /100 | #264 | Tragic 63.2% |
| Colville | 0.5 /100 | #265 | Tragic 63.2% |
| Immigrants | Western Africa | 0.5 /100 | #266 | Tragic 63.1% |
| Israelis | 0.4 /100 | #267 | Tragic 63.1% |
| Immigrants | Singapore | 0.4 /100 | #268 | Tragic 63.1% |
| Yugoslavians | 0.4 /100 | #269 | Tragic 63.1% |
| Immigrants | Austria | 0.3 /100 | #270 | Tragic 63.1% |
| Immigrants | Croatia | 0.3 /100 | #271 | Tragic 63.1% |
| Immigrants | Turkey | 0.3 /100 | #272 | Tragic 63.1% |
| Immigrants | Kazakhstan | 0.3 /100 | #273 | Tragic 63.1% |
Demographics Similar to Blackfeet by Family Households
In terms of family households, the demographic groups most similar to Blackfeet are Bulgarian (63.6%, a difference of 0.020%), Trinidadian and Tobagonian (63.6%, a difference of 0.050%), Immigrants from Bahamas (63.6%, a difference of 0.060%), Immigrants from Brazil (63.6%, a difference of 0.060%), and Immigrants from Hungary (63.6%, a difference of 0.070%).
| Demographics | Rating | Rank | Family Households |
| Immigrants | South Africa | 5.9 /100 | #221 | Tragic 63.7% |
| Immigrants | Belarus | 5.5 /100 | #222 | Tragic 63.7% |
| French Canadians | 5.4 /100 | #223 | Tragic 63.7% |
| Turks | 4.5 /100 | #224 | Tragic 63.6% |
| Immigrants | Hungary | 4.3 /100 | #225 | Tragic 63.6% |
| Immigrants | Bahamas | 4.2 /100 | #226 | Tragic 63.6% |
| Trinidadians and Tobagonians | 4.1 /100 | #227 | Tragic 63.6% |
| Blackfeet | 3.6 /100 | #228 | Tragic 63.6% |
| Bulgarians | 3.4 /100 | #229 | Tragic 63.6% |
| Immigrants | Brazil | 3.0 /100 | #230 | Tragic 63.6% |
| Immigrants | Greece | 2.9 /100 | #231 | Tragic 63.5% |
| Immigrants | Northern Africa | 2.6 /100 | #232 | Tragic 63.5% |
| Immigrants | Armenia | 2.6 /100 | #233 | Tragic 63.5% |
| Finns | 2.3 /100 | #234 | Tragic 63.5% |
| Albanians | 2.2 /100 | #235 | Tragic 63.5% |