Immigrants from Western Africa vs Blackfeet Unemployment Among Ages 16 to 19 years
COMPARE
Immigrants from Western Africa
Blackfeet
Unemployment Among Ages 16 to 19 years
Unemployment Among Ages 16 to 19 years Comparison
Immigrants from Western Africa
Blackfeet
19.4%
UNEMPLOYMENT AMONG AGES 16 TO 19 YEARS
0.0/ 100
METRIC RATING
277th/ 347
METRIC RANK
19.2%
UNEMPLOYMENT AMONG AGES 16 TO 19 YEARS
0.0/ 100
METRIC RATING
271st/ 347
METRIC RANK
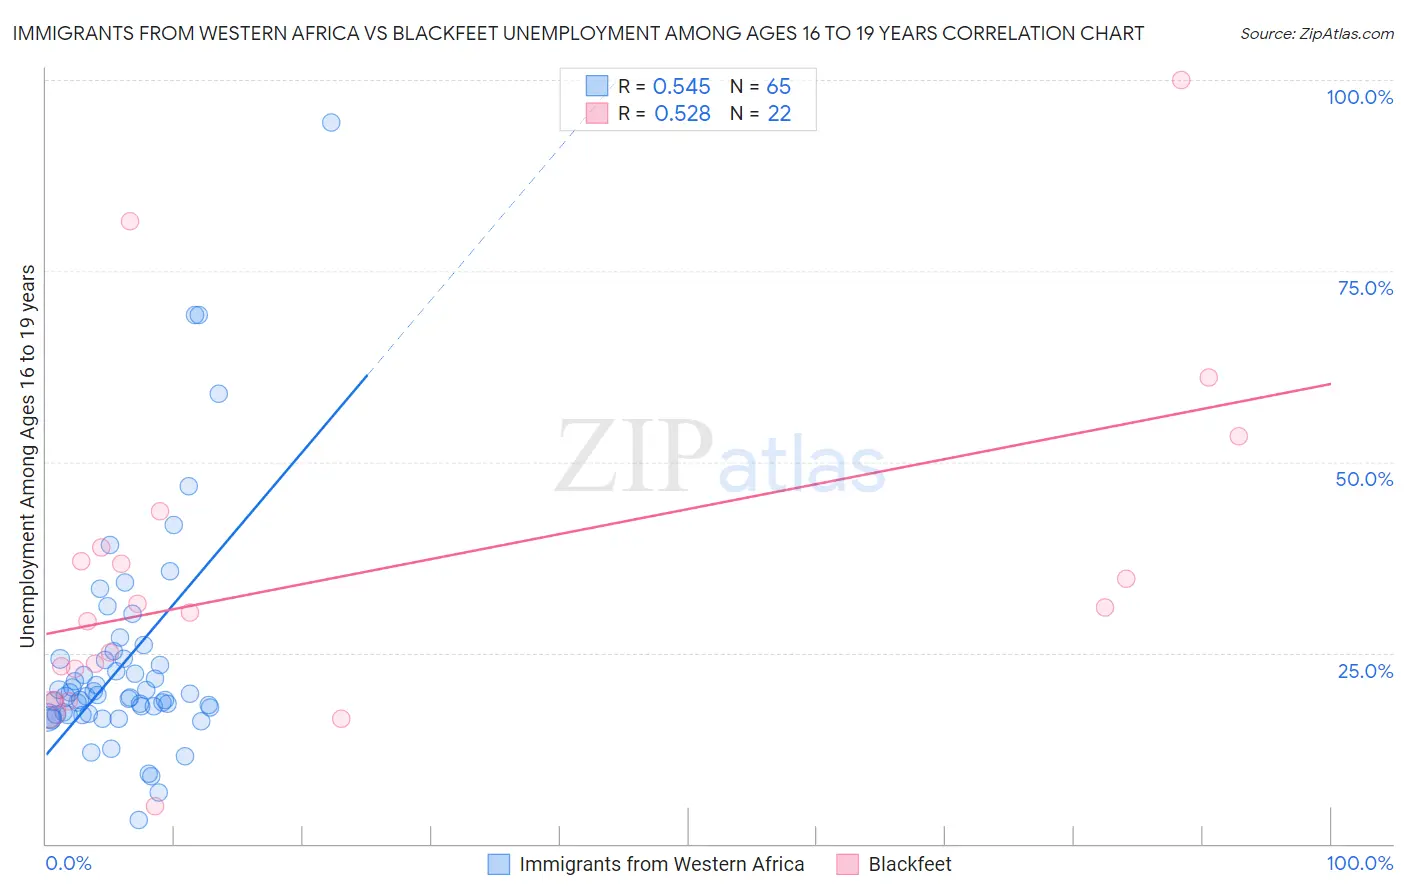
Immigrants from Western Africa vs Blackfeet Unemployment Among Ages 16 to 19 years Correlation Chart
The statistical analysis conducted on geographies consisting of 344,855,911 people shows a substantial positive correlation between the proportion of Immigrants from Western Africa and unemployment rate among population between the ages 16 and 19 in the United States with a correlation coefficient (R) of 0.545 and weighted average of 19.4%. Similarly, the statistical analysis conducted on geographies consisting of 297,030,644 people shows a substantial positive correlation between the proportion of Blackfeet and unemployment rate among population between the ages 16 and 19 in the United States with a correlation coefficient (R) of 0.528 and weighted average of 19.2%, a difference of 1.1%.
Unemployment Among Ages 16 to 19 years Correlation Summary
| Measurement | Immigrants from Western Africa | Blackfeet |
| Minimum | 3.1% | 4.9% |
| Maximum | 94.4% | 100.0% |
| Range | 91.3% | 95.1% |
| Mean | 23.9% | 35.4% |
| Median | 19.3% | 30.6% |
| Interquartile 25% (IQ1) | 17.0% | 22.9% |
| Interquartile 75% (IQ3) | 24.2% | 38.7% |
| Interquartile Range (IQR) | 7.2% | 15.9% |
| Standard Deviation (Sample) | 15.1% | 22.0% |
| Standard Deviation (Population) | 15.0% | 21.5% |
Demographics Similar to Immigrants from Western Africa and Blackfeet by Unemployment Among Ages 16 to 19 years
In terms of unemployment among ages 16 to 19 years, the demographic groups most similar to Immigrants from Western Africa are African (19.5%, a difference of 0.23%), Immigrants from Latin America (19.4%, a difference of 0.33%), Paraguayan (19.4%, a difference of 0.42%), Ute (19.6%, a difference of 0.60%), and Cajun (19.6%, a difference of 0.72%). Similarly, the demographic groups most similar to Blackfeet are Hispanic or Latino (19.2%, a difference of 0.12%), Immigrants from Panama (19.3%, a difference of 0.25%), Honduran (19.2%, a difference of 0.38%), Shoshone (19.3%, a difference of 0.40%), and Lumbee (19.1%, a difference of 0.55%).
| Demographics | Rating | Rank | Unemployment Among Ages 16 to 19 years |
| Yaqui | 0.1 /100 | #264 | Tragic 19.0% |
| Choctaw | 0.1 /100 | #265 | Tragic 19.0% |
| Immigrants | Honduras | 0.1 /100 | #266 | Tragic 19.0% |
| Israelis | 0.1 /100 | #267 | Tragic 19.0% |
| Immigrants | El Salvador | 0.1 /100 | #268 | Tragic 19.1% |
| Lumbee | 0.1 /100 | #269 | Tragic 19.1% |
| Hondurans | 0.1 /100 | #270 | Tragic 19.2% |
| Blackfeet | 0.0 /100 | #271 | Tragic 19.2% |
| Hispanics or Latinos | 0.0 /100 | #272 | Tragic 19.2% |
| Immigrants | Panama | 0.0 /100 | #273 | Tragic 19.3% |
| Shoshone | 0.0 /100 | #274 | Tragic 19.3% |
| Paraguayans | 0.0 /100 | #275 | Tragic 19.4% |
| Immigrants | Latin America | 0.0 /100 | #276 | Tragic 19.4% |
| Immigrants | Western Africa | 0.0 /100 | #277 | Tragic 19.4% |
| Africans | 0.0 /100 | #278 | Tragic 19.5% |
| Ute | 0.0 /100 | #279 | Tragic 19.6% |
| Cajuns | 0.0 /100 | #280 | Tragic 19.6% |
| Cypriots | 0.0 /100 | #281 | Tragic 19.6% |
| Dutch West Indians | 0.0 /100 | #282 | Tragic 19.7% |
| Sioux | 0.0 /100 | #283 | Tragic 19.7% |
| Sierra Leoneans | 0.0 /100 | #284 | Tragic 19.7% |