Immigrants from West Indies vs Immigrants from Sierra Leone Single Mother Households
COMPARE
Immigrants from West Indies
Immigrants from Sierra Leone
Single Mother Households
Single Mother Households Comparison
Immigrants from West Indies
Immigrants from Sierra Leone
7.9%
SINGLE MOTHER HOUSEHOLDS
0.0/ 100
METRIC RATING
298th/ 347
METRIC RANK
7.7%
SINGLE MOTHER HOUSEHOLDS
0.0/ 100
METRIC RATING
280th/ 347
METRIC RANK
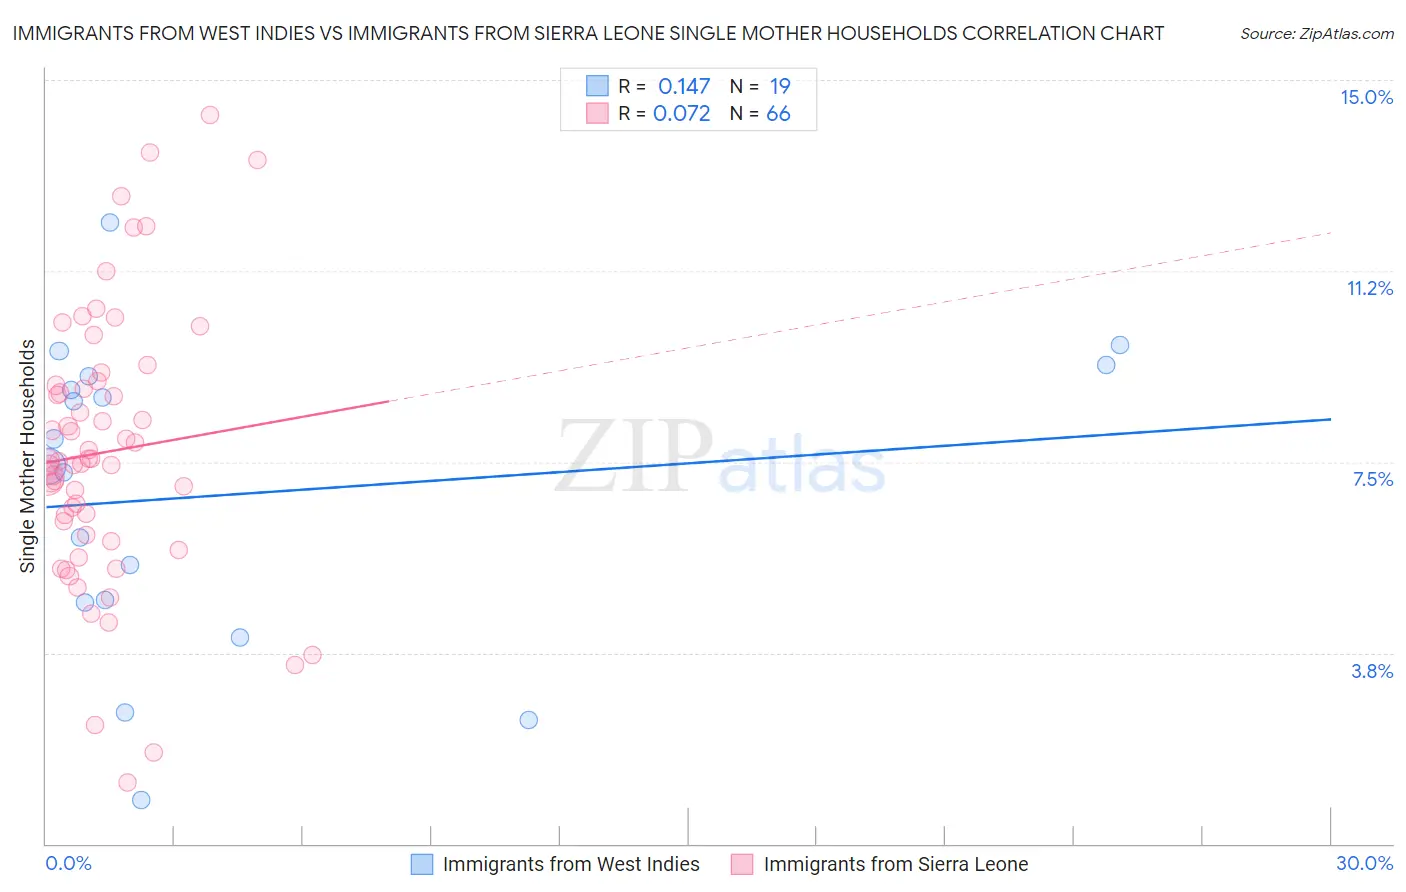
Immigrants from West Indies vs Immigrants from Sierra Leone Single Mother Households Correlation Chart
The statistical analysis conducted on geographies consisting of 72,447,708 people shows a poor positive correlation between the proportion of Immigrants from West Indies and percentage of single mother households in the United States with a correlation coefficient (R) of 0.147 and weighted average of 7.9%. Similarly, the statistical analysis conducted on geographies consisting of 101,563,361 people shows a slight positive correlation between the proportion of Immigrants from Sierra Leone and percentage of single mother households in the United States with a correlation coefficient (R) of 0.072 and weighted average of 7.7%, a difference of 3.4%.
Single Mother Households Correlation Summary
| Measurement | Immigrants from West Indies | Immigrants from Sierra Leone |
| Minimum | 0.85% | 1.2% |
| Maximum | 12.2% | 14.3% |
| Range | 11.4% | 13.1% |
| Mean | 6.9% | 7.7% |
| Median | 7.4% | 7.5% |
| Interquartile 25% (IQ1) | 4.7% | 6.1% |
| Interquartile 75% (IQ3) | 9.2% | 9.0% |
| Interquartile Range (IQR) | 4.4% | 3.0% |
| Standard Deviation (Sample) | 3.0% | 2.7% |
| Standard Deviation (Population) | 2.9% | 2.7% |
Demographics Similar to Immigrants from West Indies and Immigrants from Sierra Leone by Single Mother Households
In terms of single mother households, the demographic groups most similar to Immigrants from West Indies are Houma (7.9%, a difference of 0.080%), Hispanic or Latino (7.9%, a difference of 0.11%), Immigrants from Latin America (7.9%, a difference of 0.15%), Barbadian (7.9%, a difference of 0.22%), and Apache (7.9%, a difference of 0.51%). Similarly, the demographic groups most similar to Immigrants from Sierra Leone are Immigrants from Laos (7.7%, a difference of 0.0%), Guatemalan (7.7%, a difference of 0.020%), Nigerian (7.7%, a difference of 0.050%), Immigrants from El Salvador (7.6%, a difference of 0.52%), and Immigrants from Belize (7.7%, a difference of 0.65%).
| Demographics | Rating | Rank | Single Mother Households |
| Immigrants | El Salvador | 0.0 /100 | #279 | Tragic 7.6% |
| Immigrants | Sierra Leone | 0.0 /100 | #280 | Tragic 7.7% |
| Immigrants | Laos | 0.0 /100 | #281 | Tragic 7.7% |
| Guatemalans | 0.0 /100 | #282 | Tragic 7.7% |
| Nigerians | 0.0 /100 | #283 | Tragic 7.7% |
| Immigrants | Belize | 0.0 /100 | #284 | Tragic 7.7% |
| Trinidadians and Tobagonians | 0.0 /100 | #285 | Tragic 7.7% |
| Immigrants | Middle Africa | 0.0 /100 | #286 | Tragic 7.7% |
| Immigrants | Guatemala | 0.0 /100 | #287 | Tragic 7.7% |
| Sierra Leoneans | 0.0 /100 | #288 | Tragic 7.7% |
| Sub-Saharan Africans | 0.0 /100 | #289 | Tragic 7.8% |
| Immigrants | Nigeria | 0.0 /100 | #290 | Tragic 7.8% |
| West Indians | 0.0 /100 | #291 | Tragic 7.8% |
| Ghanaians | 0.0 /100 | #292 | Tragic 7.8% |
| Immigrants | Cameroon | 0.0 /100 | #293 | Tragic 7.9% |
| Apache | 0.0 /100 | #294 | Tragic 7.9% |
| Barbadians | 0.0 /100 | #295 | Tragic 7.9% |
| Immigrants | Latin America | 0.0 /100 | #296 | Tragic 7.9% |
| Hispanics or Latinos | 0.0 /100 | #297 | Tragic 7.9% |
| Immigrants | West Indies | 0.0 /100 | #298 | Tragic 7.9% |
| Houma | 0.0 /100 | #299 | Tragic 7.9% |