Immigrants from West Indies vs Immigrants from Brazil Single Mother Households
COMPARE
Immigrants from West Indies
Immigrants from Brazil
Single Mother Households
Single Mother Households Comparison
Immigrants from West Indies
Immigrants from Brazil
7.9%
SINGLE MOTHER HOUSEHOLDS
0.0/ 100
METRIC RATING
298th/ 347
METRIC RANK
6.1%
SINGLE MOTHER HOUSEHOLDS
78.9/ 100
METRIC RATING
153rd/ 347
METRIC RANK
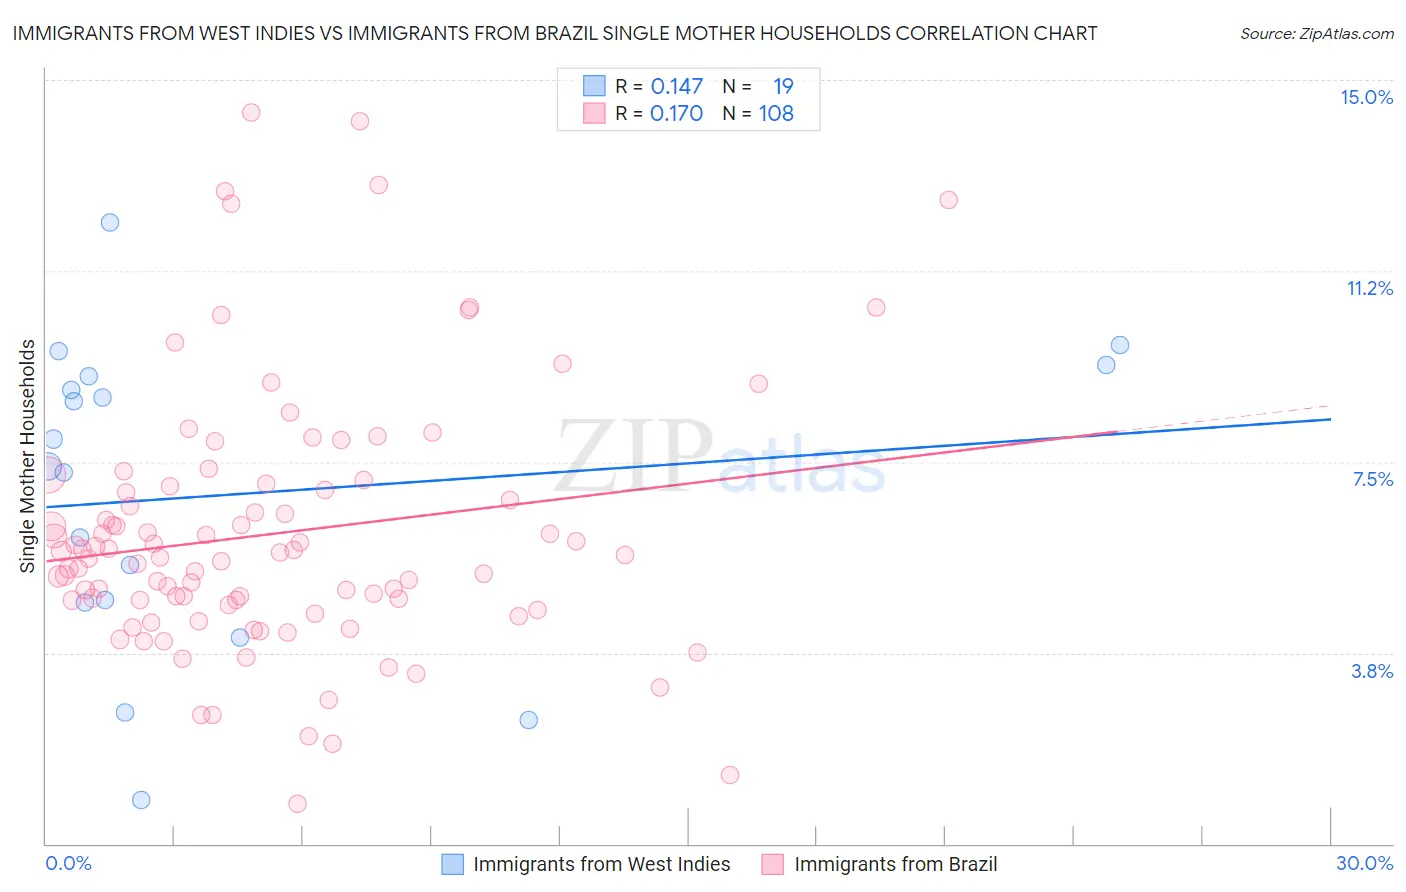
Immigrants from West Indies vs Immigrants from Brazil Single Mother Households Correlation Chart
The statistical analysis conducted on geographies consisting of 72,447,708 people shows a poor positive correlation between the proportion of Immigrants from West Indies and percentage of single mother households in the United States with a correlation coefficient (R) of 0.147 and weighted average of 7.9%. Similarly, the statistical analysis conducted on geographies consisting of 342,403,937 people shows a poor positive correlation between the proportion of Immigrants from Brazil and percentage of single mother households in the United States with a correlation coefficient (R) of 0.170 and weighted average of 6.1%, a difference of 30.2%.
Single Mother Households Correlation Summary
| Measurement | Immigrants from West Indies | Immigrants from Brazil |
| Minimum | 0.85% | 0.79% |
| Maximum | 12.2% | 14.4% |
| Range | 11.4% | 13.6% |
| Mean | 6.9% | 6.1% |
| Median | 7.4% | 5.7% |
| Interquartile 25% (IQ1) | 4.7% | 4.7% |
| Interquartile 75% (IQ3) | 9.2% | 7.0% |
| Interquartile Range (IQR) | 4.4% | 2.2% |
| Standard Deviation (Sample) | 3.0% | 2.6% |
| Standard Deviation (Population) | 2.9% | 2.6% |
Similar Demographics by Single Mother Households
Demographics Similar to Immigrants from West Indies by Single Mother Households
In terms of single mother households, the demographic groups most similar to Immigrants from West Indies are Houma (7.9%, a difference of 0.080%), Hispanic or Latino (7.9%, a difference of 0.11%), Immigrants from Latin America (7.9%, a difference of 0.15%), Barbadian (7.9%, a difference of 0.22%), and Apache (7.9%, a difference of 0.51%).
| Demographics | Rating | Rank | Single Mother Households |
| West Indians | 0.0 /100 | #291 | Tragic 7.8% |
| Ghanaians | 0.0 /100 | #292 | Tragic 7.8% |
| Immigrants | Cameroon | 0.0 /100 | #293 | Tragic 7.9% |
| Apache | 0.0 /100 | #294 | Tragic 7.9% |
| Barbadians | 0.0 /100 | #295 | Tragic 7.9% |
| Immigrants | Latin America | 0.0 /100 | #296 | Tragic 7.9% |
| Hispanics or Latinos | 0.0 /100 | #297 | Tragic 7.9% |
| Immigrants | West Indies | 0.0 /100 | #298 | Tragic 7.9% |
| Houma | 0.0 /100 | #299 | Tragic 7.9% |
| Mexicans | 0.0 /100 | #300 | Tragic 8.0% |
| Chippewa | 0.0 /100 | #301 | Tragic 8.0% |
| Immigrants | Ghana | 0.0 /100 | #302 | Tragic 8.0% |
| Immigrants | Bahamas | 0.0 /100 | #303 | Tragic 8.0% |
| Natives/Alaskans | 0.0 /100 | #304 | Tragic 8.0% |
| Colville | 0.0 /100 | #305 | Tragic 8.0% |
Demographics Similar to Immigrants from Brazil by Single Mother Households
In terms of single mother households, the demographic groups most similar to Immigrants from Brazil are Pakistani (6.1%, a difference of 0.040%), Immigrants from Philippines (6.1%, a difference of 0.070%), Immigrants from Southern Europe (6.1%, a difference of 0.27%), Zimbabwean (6.1%, a difference of 0.32%), and White/Caucasian (6.1%, a difference of 0.40%).
| Demographics | Rating | Rank | Single Mother Households |
| French Canadians | 82.6 /100 | #146 | Excellent 6.0% |
| Immigrants | Jordan | 82.3 /100 | #147 | Excellent 6.0% |
| Scotch-Irish | 82.0 /100 | #148 | Excellent 6.0% |
| Immigrants | Albania | 81.5 /100 | #149 | Excellent 6.1% |
| Zimbabweans | 80.7 /100 | #150 | Excellent 6.1% |
| Immigrants | Southern Europe | 80.5 /100 | #151 | Excellent 6.1% |
| Pakistanis | 79.2 /100 | #152 | Good 6.1% |
| Immigrants | Brazil | 78.9 /100 | #153 | Good 6.1% |
| Immigrants | Philippines | 78.5 /100 | #154 | Good 6.1% |
| Whites/Caucasians | 76.5 /100 | #155 | Good 6.1% |
| Native Hawaiians | 75.0 /100 | #156 | Good 6.1% |
| Chileans | 74.2 /100 | #157 | Good 6.1% |
| Celtics | 73.3 /100 | #158 | Good 6.1% |
| Yugoslavians | 73.1 /100 | #159 | Good 6.1% |
| Iraqis | 73.0 /100 | #160 | Good 6.1% |