Immigrants from Venezuela vs Ecuadorian Currently Married
COMPARE
Immigrants from Venezuela
Ecuadorian
Currently Married
Currently Married Comparison
Immigrants from Venezuela
Ecuadorians
47.0%
CURRENTLY MARRIED
68.6/ 100
METRIC RATING
153rd/ 347
METRIC RANK
43.6%
CURRENTLY MARRIED
0.1/ 100
METRIC RATING
266th/ 347
METRIC RANK
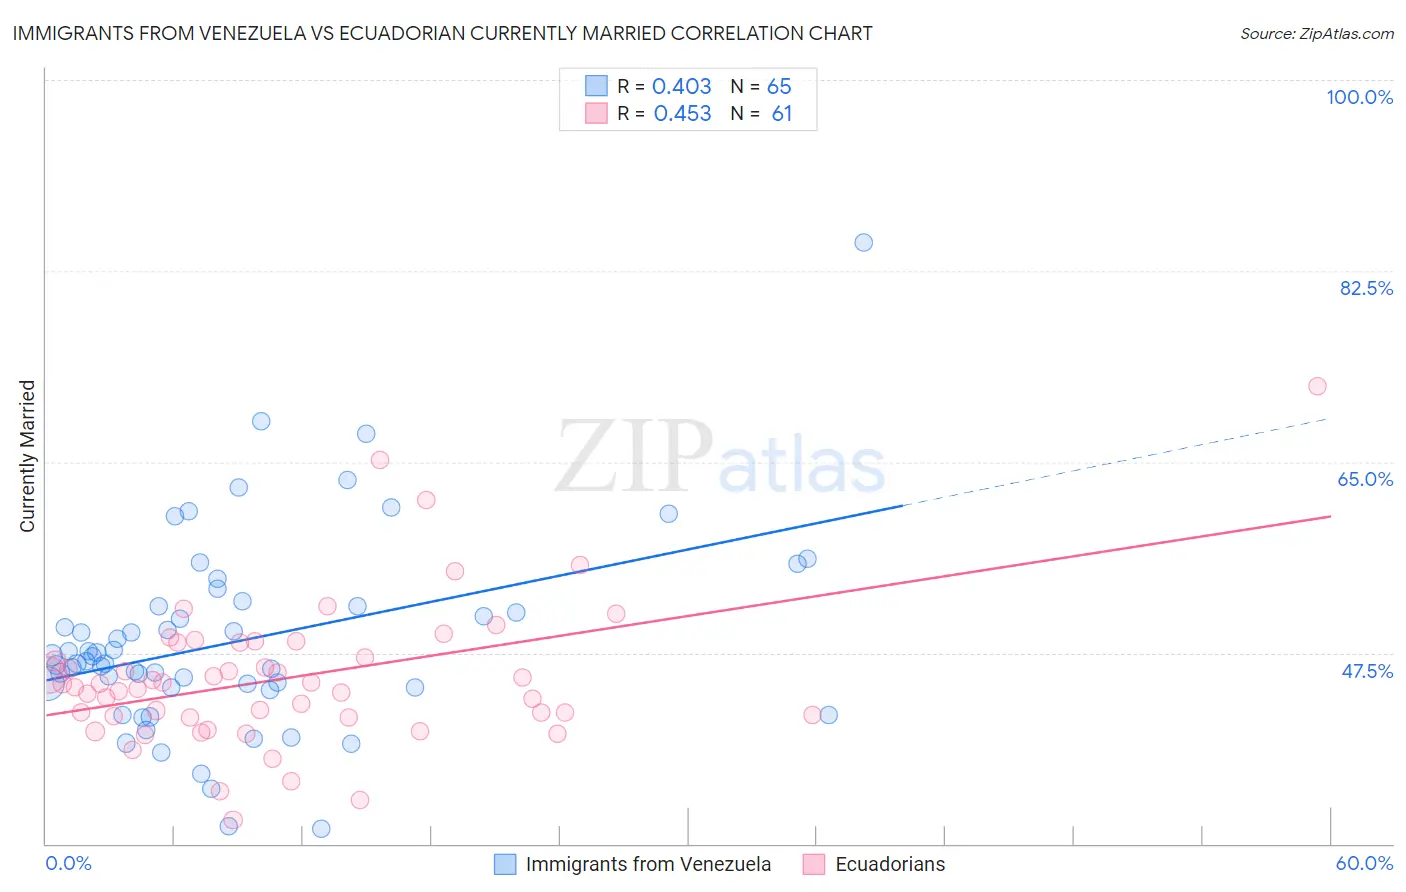
Immigrants from Venezuela vs Ecuadorian Currently Married Correlation Chart
The statistical analysis conducted on geographies consisting of 287,838,026 people shows a moderate positive correlation between the proportion of Immigrants from Venezuela and percentage of population currently married in the United States with a correlation coefficient (R) of 0.403 and weighted average of 47.0%. Similarly, the statistical analysis conducted on geographies consisting of 317,807,476 people shows a moderate positive correlation between the proportion of Ecuadorians and percentage of population currently married in the United States with a correlation coefficient (R) of 0.453 and weighted average of 43.6%, a difference of 7.7%.
Currently Married Correlation Summary
| Measurement | Immigrants from Venezuela | Ecuadorian |
| Minimum | 31.4% | 32.2% |
| Maximum | 85.1% | 71.9% |
| Range | 53.7% | 39.7% |
| Mean | 48.6% | 45.2% |
| Median | 46.7% | 44.6% |
| Interquartile 25% (IQ1) | 44.3% | 41.7% |
| Interquartile 75% (IQ3) | 51.7% | 48.4% |
| Interquartile Range (IQR) | 7.4% | 6.8% |
| Standard Deviation (Sample) | 9.0% | 6.7% |
| Standard Deviation (Population) | 8.9% | 6.7% |
Similar Demographics by Currently Married
Demographics Similar to Immigrants from Venezuela by Currently Married
In terms of currently married, the demographic groups most similar to Immigrants from Venezuela are Albanian (47.0%, a difference of 0.0%), Arab (47.0%, a difference of 0.0%), Immigrants from Serbia (47.0%, a difference of 0.010%), Spanish (47.0%, a difference of 0.020%), and Immigrants from Switzerland (46.9%, a difference of 0.030%).
| Demographics | Rating | Rank | Currently Married |
| Carpatho Rusyns | 72.6 /100 | #146 | Good 47.0% |
| Immigrants | Argentina | 72.0 /100 | #147 | Good 47.0% |
| Cambodians | 70.4 /100 | #148 | Good 47.0% |
| Zimbabweans | 70.1 /100 | #149 | Good 47.0% |
| Immigrants | Turkey | 70.0 /100 | #150 | Good 47.0% |
| Chileans | 69.8 /100 | #151 | Good 47.0% |
| Immigrants | Serbia | 68.8 /100 | #152 | Good 47.0% |
| Immigrants | Venezuela | 68.6 /100 | #153 | Good 47.0% |
| Albanians | 68.6 /100 | #154 | Good 47.0% |
| Arabs | 68.6 /100 | #155 | Good 47.0% |
| Spanish | 68.1 /100 | #156 | Good 47.0% |
| Immigrants | Switzerland | 67.8 /100 | #157 | Good 46.9% |
| Cherokee | 66.8 /100 | #158 | Good 46.9% |
| Iraqis | 66.4 /100 | #159 | Good 46.9% |
| Immigrants | Uzbekistan | 66.0 /100 | #160 | Good 46.9% |
Demographics Similar to Ecuadorians by Currently Married
In terms of currently married, the demographic groups most similar to Ecuadorians are Immigrants from Eritrea (43.6%, a difference of 0.030%), Spanish American Indian (43.6%, a difference of 0.030%), Immigrants from Bangladesh (43.6%, a difference of 0.070%), Sudanese (43.7%, a difference of 0.15%), and Immigrants from Cuba (43.7%, a difference of 0.16%).
| Demographics | Rating | Rank | Currently Married |
| Immigrants | Sierra Leone | 0.1 /100 | #259 | Tragic 43.8% |
| Immigrants | Latin America | 0.1 /100 | #260 | Tragic 43.8% |
| Immigrants | Nicaragua | 0.1 /100 | #261 | Tragic 43.7% |
| Bangladeshis | 0.1 /100 | #262 | Tragic 43.7% |
| Immigrants | Cuba | 0.1 /100 | #263 | Tragic 43.7% |
| Sudanese | 0.1 /100 | #264 | Tragic 43.7% |
| Immigrants | Bangladesh | 0.1 /100 | #265 | Tragic 43.6% |
| Ecuadorians | 0.1 /100 | #266 | Tragic 43.6% |
| Immigrants | Eritrea | 0.1 /100 | #267 | Tragic 43.6% |
| Spanish American Indians | 0.1 /100 | #268 | Tragic 43.6% |
| Immigrants | Sudan | 0.1 /100 | #269 | Tragic 43.5% |
| Salvadorans | 0.1 /100 | #270 | Tragic 43.5% |
| Bermudans | 0.1 /100 | #271 | Tragic 43.5% |
| Indonesians | 0.1 /100 | #272 | Tragic 43.5% |
| Yaqui | 0.1 /100 | #273 | Tragic 43.4% |