Immigrants from Ukraine vs Kenyan Single Mother Households
COMPARE
Immigrants from Ukraine
Kenyan
Single Mother Households
Single Mother Households Comparison
Immigrants from Ukraine
Kenyans
5.8%
SINGLE MOTHER HOUSEHOLDS
95.9/ 100
METRIC RATING
106th/ 347
METRIC RANK
7.0%
SINGLE MOTHER HOUSEHOLDS
2.3/ 100
METRIC RATING
227th/ 347
METRIC RANK
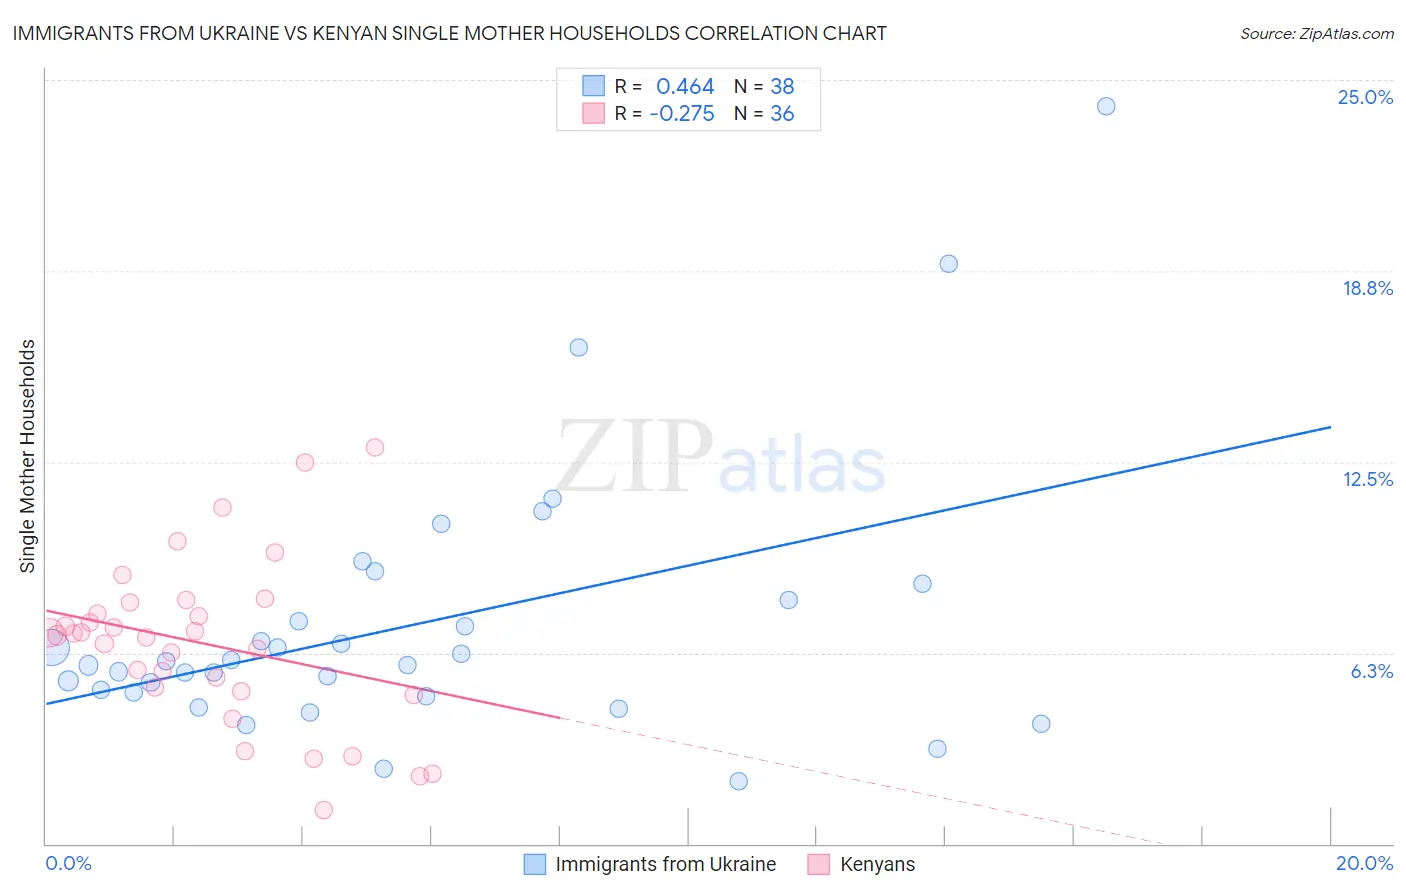
Immigrants from Ukraine vs Kenyan Single Mother Households Correlation Chart
The statistical analysis conducted on geographies consisting of 289,094,970 people shows a moderate positive correlation between the proportion of Immigrants from Ukraine and percentage of single mother households in the United States with a correlation coefficient (R) of 0.464 and weighted average of 5.8%. Similarly, the statistical analysis conducted on geographies consisting of 168,075,202 people shows a weak negative correlation between the proportion of Kenyans and percentage of single mother households in the United States with a correlation coefficient (R) of -0.275 and weighted average of 7.0%, a difference of 20.7%.
Single Mother Households Correlation Summary
| Measurement | Immigrants from Ukraine | Kenyan |
| Minimum | 2.1% | 1.1% |
| Maximum | 24.1% | 13.0% |
| Range | 22.1% | 11.9% |
| Mean | 7.2% | 6.5% |
| Median | 5.9% | 6.9% |
| Interquartile 25% (IQ1) | 4.9% | 5.0% |
| Interquartile 75% (IQ3) | 8.0% | 7.7% |
| Interquartile Range (IQR) | 3.1% | 2.7% |
| Standard Deviation (Sample) | 4.4% | 2.7% |
| Standard Deviation (Population) | 4.3% | 2.7% |
Similar Demographics by Single Mother Households
Demographics Similar to Immigrants from Ukraine by Single Mother Households
In terms of single mother households, the demographic groups most similar to Immigrants from Ukraine are Taiwanese (5.8%, a difference of 0.10%), Paraguayan (5.8%, a difference of 0.11%), Immigrants from Italy (5.8%, a difference of 0.12%), Scottish (5.8%, a difference of 0.18%), and Northern European (5.8%, a difference of 0.18%).
| Demographics | Rating | Rank | Single Mother Households |
| Immigrants | Poland | 96.3 /100 | #99 | Exceptional 5.8% |
| Scandinavians | 96.2 /100 | #100 | Exceptional 5.8% |
| Germans | 96.2 /100 | #101 | Exceptional 5.8% |
| English | 96.2 /100 | #102 | Exceptional 5.8% |
| Scottish | 96.2 /100 | #103 | Exceptional 5.8% |
| Northern Europeans | 96.2 /100 | #104 | Exceptional 5.8% |
| Taiwanese | 96.1 /100 | #105 | Exceptional 5.8% |
| Immigrants | Ukraine | 95.9 /100 | #106 | Exceptional 5.8% |
| Paraguayans | 95.8 /100 | #107 | Exceptional 5.8% |
| Immigrants | Italy | 95.8 /100 | #108 | Exceptional 5.8% |
| Immigrants | Western Europe | 95.7 /100 | #109 | Exceptional 5.8% |
| British | 95.5 /100 | #110 | Exceptional 5.8% |
| Immigrants | England | 95.5 /100 | #111 | Exceptional 5.8% |
| Immigrants | Kuwait | 95.4 /100 | #112 | Exceptional 5.8% |
| Mongolians | 95.3 /100 | #113 | Exceptional 5.8% |
Demographics Similar to Kenyans by Single Mother Households
In terms of single mother households, the demographic groups most similar to Kenyans are Iroquois (7.0%, a difference of 0.030%), Paiute (7.0%, a difference of 0.14%), Immigrants from Kenya (7.0%, a difference of 0.20%), Sudanese (6.9%, a difference of 0.82%), and Creek (7.0%, a difference of 0.91%).
| Demographics | Rating | Rank | Single Mother Households |
| Immigrants | Thailand | 4.0 /100 | #220 | Tragic 6.9% |
| French American Indians | 3.7 /100 | #221 | Tragic 6.9% |
| Immigrants | Bangladesh | 3.7 /100 | #222 | Tragic 6.9% |
| Immigrants | Micronesia | 3.6 /100 | #223 | Tragic 6.9% |
| Immigrants | Sudan | 3.5 /100 | #224 | Tragic 6.9% |
| Sudanese | 3.1 /100 | #225 | Tragic 6.9% |
| Paiute | 2.4 /100 | #226 | Tragic 7.0% |
| Kenyans | 2.3 /100 | #227 | Tragic 7.0% |
| Iroquois | 2.2 /100 | #228 | Tragic 7.0% |
| Immigrants | Kenya | 2.1 /100 | #229 | Tragic 7.0% |
| Creek | 1.6 /100 | #230 | Tragic 7.0% |
| Spanish Americans | 1.6 /100 | #231 | Tragic 7.0% |
| Comanche | 1.5 /100 | #232 | Tragic 7.0% |
| Choctaw | 1.4 /100 | #233 | Tragic 7.0% |
| Chickasaw | 1.4 /100 | #234 | Tragic 7.0% |