Immigrants from Bangladesh vs Immigrants from Eastern Africa Births to Unmarried Women
COMPARE
Immigrants from Bangladesh
Immigrants from Eastern Africa
Births to Unmarried Women
Births to Unmarried Women Comparison
Immigrants from Bangladesh
Immigrants from Eastern Africa
30.9%
BIRTHS TO UNMARRIED WOMEN
73.9/ 100
METRIC RATING
155th/ 347
METRIC RANK
31.0%
BIRTHS TO UNMARRIED WOMEN
72.1/ 100
METRIC RATING
157th/ 347
METRIC RANK
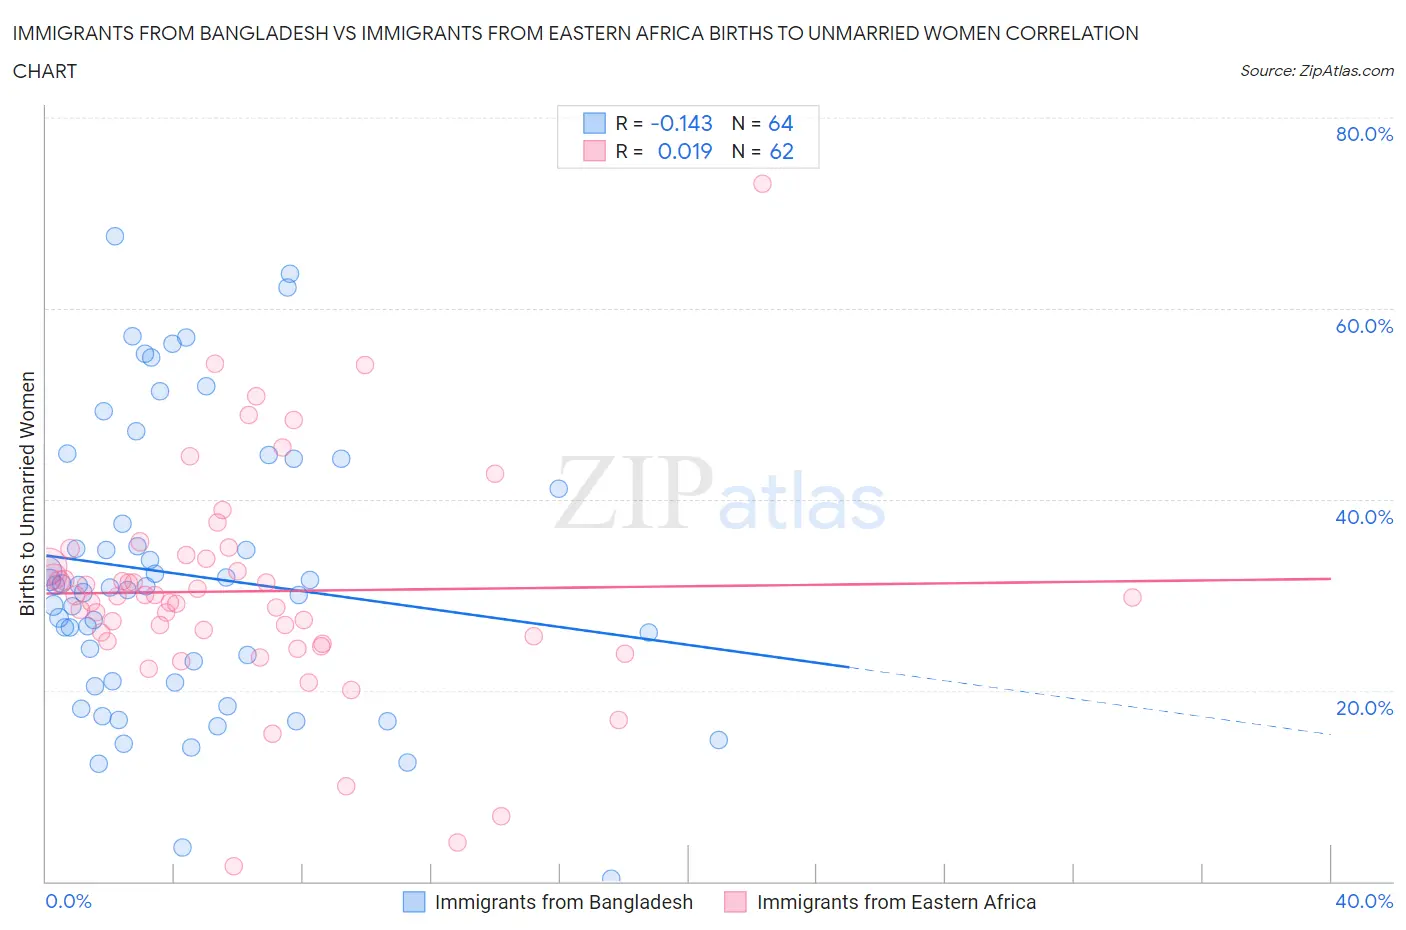
Immigrants from Bangladesh vs Immigrants from Eastern Africa Births to Unmarried Women Correlation Chart
The statistical analysis conducted on geographies consisting of 195,686,757 people shows a poor negative correlation between the proportion of Immigrants from Bangladesh and percentage of births to unmarried women in the United States with a correlation coefficient (R) of -0.143 and weighted average of 30.9%. Similarly, the statistical analysis conducted on geographies consisting of 336,393,079 people shows no correlation between the proportion of Immigrants from Eastern Africa and percentage of births to unmarried women in the United States with a correlation coefficient (R) of 0.019 and weighted average of 31.0%, a difference of 0.22%.
Births to Unmarried Women Correlation Summary
| Measurement | Immigrants from Bangladesh | Immigrants from Eastern Africa |
| Minimum | 0.20% | 1.6% |
| Maximum | 67.6% | 73.0% |
| Range | 67.4% | 71.4% |
| Mean | 32.1% | 30.4% |
| Median | 30.8% | 29.8% |
| Interquartile 25% (IQ1) | 20.9% | 25.2% |
| Interquartile 75% (IQ3) | 42.6% | 33.8% |
| Interquartile Range (IQR) | 21.8% | 8.6% |
| Standard Deviation (Sample) | 14.9% | 11.7% |
| Standard Deviation (Population) | 14.8% | 11.6% |
Demographics Similar to Immigrants from Bangladesh and Immigrants from Eastern Africa by Births to Unmarried Women
In terms of births to unmarried women, the demographic groups most similar to Immigrants from Bangladesh are Carpatho Rusyn (30.9%, a difference of 0.050%), Yugoslavian (30.8%, a difference of 0.15%), British (30.8%, a difference of 0.27%), Polish (30.8%, a difference of 0.29%), and Italian (30.8%, a difference of 0.40%). Similarly, the demographic groups most similar to Immigrants from Eastern Africa are Carpatho Rusyn (30.9%, a difference of 0.17%), Austrian (31.0%, a difference of 0.27%), Immigrants from England (31.1%, a difference of 0.32%), Immigrants from Western Europe (31.1%, a difference of 0.33%), and Yugoslavian (30.8%, a difference of 0.38%).
| Demographics | Rating | Rank | Births to Unmarried Women |
| Northern Europeans | 81.4 /100 | #146 | Excellent 30.6% |
| Immigrants | Oceania | 81.2 /100 | #147 | Excellent 30.6% |
| Chileans | 79.1 /100 | #148 | Good 30.7% |
| Serbians | 78.8 /100 | #149 | Good 30.7% |
| Somalis | 77.8 /100 | #150 | Good 30.7% |
| Italians | 77.0 /100 | #151 | Good 30.8% |
| Poles | 76.2 /100 | #152 | Good 30.8% |
| British | 76.0 /100 | #153 | Good 30.8% |
| Yugoslavians | 75.1 /100 | #154 | Good 30.8% |
| Immigrants | Bangladesh | 73.9 /100 | #155 | Good 30.9% |
| Carpatho Rusyns | 73.5 /100 | #156 | Good 30.9% |
| Immigrants | Eastern Africa | 72.1 /100 | #157 | Good 31.0% |
| Austrians | 69.9 /100 | #158 | Good 31.0% |
| Immigrants | England | 69.4 /100 | #159 | Good 31.1% |
| Immigrants | Western Europe | 69.3 /100 | #160 | Good 31.1% |
| Immigrants | Southern Europe | 68.7 /100 | #161 | Good 31.1% |
| Slovenes | 65.9 /100 | #162 | Good 31.2% |
| Immigrants | Chile | 65.7 /100 | #163 | Good 31.2% |
| Hungarians | 64.1 /100 | #164 | Good 31.2% |
| Immigrants | Somalia | 58.1 /100 | #165 | Average 31.4% |
| Peruvians | 55.5 /100 | #166 | Average 31.5% |