Soviet Union vs Laotian Divorced or Separated
COMPARE
Soviet Union
Laotian
Divorced or Separated
Divorced or Separated Comparison
Soviet Union
Laotians
11.1%
DIVORCED OR SEPARATED
100.0/ 100
METRIC RATING
40th/ 347
METRIC RANK
11.2%
DIVORCED OR SEPARATED
100.0/ 100
METRIC RATING
46th/ 347
METRIC RANK
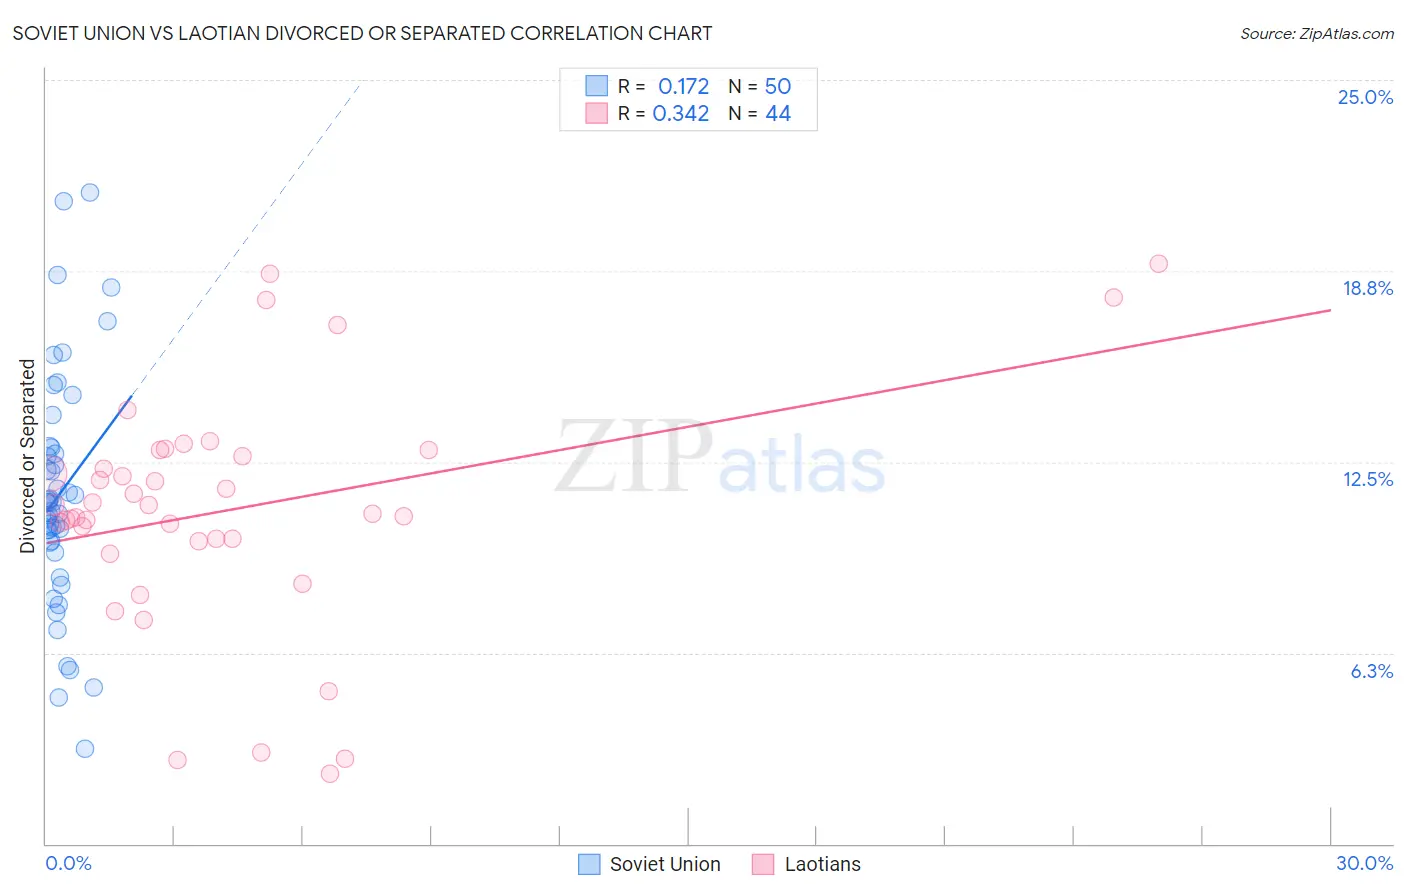
Soviet Union vs Laotian Divorced or Separated Correlation Chart
The statistical analysis conducted on geographies consisting of 43,509,630 people shows a poor positive correlation between the proportion of Soviet Union and percentage of population currently divorced or separated in the United States with a correlation coefficient (R) of 0.172 and weighted average of 11.1%. Similarly, the statistical analysis conducted on geographies consisting of 224,772,196 people shows a mild positive correlation between the proportion of Laotians and percentage of population currently divorced or separated in the United States with a correlation coefficient (R) of 0.342 and weighted average of 11.2%, a difference of 0.52%.
Divorced or Separated Correlation Summary
| Measurement | Soviet Union | Laotian |
| Minimum | 3.1% | 2.3% |
| Maximum | 21.3% | 19.0% |
| Range | 18.2% | 16.7% |
| Mean | 11.4% | 10.9% |
| Median | 11.2% | 10.9% |
| Interquartile 25% (IQ1) | 9.9% | 9.9% |
| Interquartile 75% (IQ3) | 13.0% | 12.8% |
| Interquartile Range (IQR) | 3.1% | 2.9% |
| Standard Deviation (Sample) | 3.9% | 3.9% |
| Standard Deviation (Population) | 3.8% | 3.8% |
Demographics Similar to Soviet Union and Laotians by Divorced or Separated
In terms of divorced or separated, the demographic groups most similar to Soviet Union are Immigrants from Egypt (11.1%, a difference of 0.090%), Bhutanese (11.2%, a difference of 0.28%), Immigrants from Greece (11.1%, a difference of 0.33%), Chinese (11.2%, a difference of 0.34%), and Immigrants from Belarus (11.2%, a difference of 0.35%). Similarly, the demographic groups most similar to Laotians are Immigrants from Poland (11.2%, a difference of 0.010%), Immigrants from Turkey (11.2%, a difference of 0.040%), Immigrants from Saudi Arabia (11.2%, a difference of 0.050%), Turkish (11.2%, a difference of 0.11%), and Bolivian (11.2%, a difference of 0.12%).
| Demographics | Rating | Rank | Divorced or Separated |
| Egyptians | 100.0 /100 | #33 | Exceptional 11.1% |
| Immigrants | Uzbekistan | 100.0 /100 | #34 | Exceptional 11.1% |
| Cambodians | 100.0 /100 | #35 | Exceptional 11.1% |
| Immigrants | Japan | 100.0 /100 | #36 | Exceptional 11.1% |
| Immigrants | Lebanon | 100.0 /100 | #37 | Exceptional 11.1% |
| Immigrants | Greece | 100.0 /100 | #38 | Exceptional 11.1% |
| Immigrants | Egypt | 100.0 /100 | #39 | Exceptional 11.1% |
| Soviet Union | 100.0 /100 | #40 | Exceptional 11.1% |
| Bhutanese | 100.0 /100 | #41 | Exceptional 11.2% |
| Chinese | 100.0 /100 | #42 | Exceptional 11.2% |
| Immigrants | Belarus | 100.0 /100 | #43 | Exceptional 11.2% |
| Immigrants | Western Asia | 100.0 /100 | #44 | Exceptional 11.2% |
| Turks | 100.0 /100 | #45 | Exceptional 11.2% |
| Laotians | 100.0 /100 | #46 | Exceptional 11.2% |
| Immigrants | Poland | 100.0 /100 | #47 | Exceptional 11.2% |
| Immigrants | Turkey | 100.0 /100 | #48 | Exceptional 11.2% |
| Immigrants | Saudi Arabia | 100.0 /100 | #49 | Exceptional 11.2% |
| Bolivians | 100.0 /100 | #50 | Exceptional 11.2% |
| Immigrants | Bolivia | 100.0 /100 | #51 | Exceptional 11.3% |
| Immigrants | Australia | 99.9 /100 | #52 | Exceptional 11.3% |
| Immigrants | Lithuania | 99.9 /100 | #53 | Exceptional 11.3% |