Immigrants from Trinidad and Tobago vs Black/African American Disability Age 18 to 34
COMPARE
Immigrants from Trinidad and Tobago
Black/African American
Disability Age 18 to 34
Disability Age 18 to 34 Comparison
Immigrants from Trinidad and Tobago
Blacks/African Americans
5.9%
DISABILITY AGE 18 TO 34
99.8/ 100
METRIC RATING
48th/ 347
METRIC RANK
7.7%
DISABILITY AGE 18 TO 34
0.0/ 100
METRIC RATING
292nd/ 347
METRIC RANK
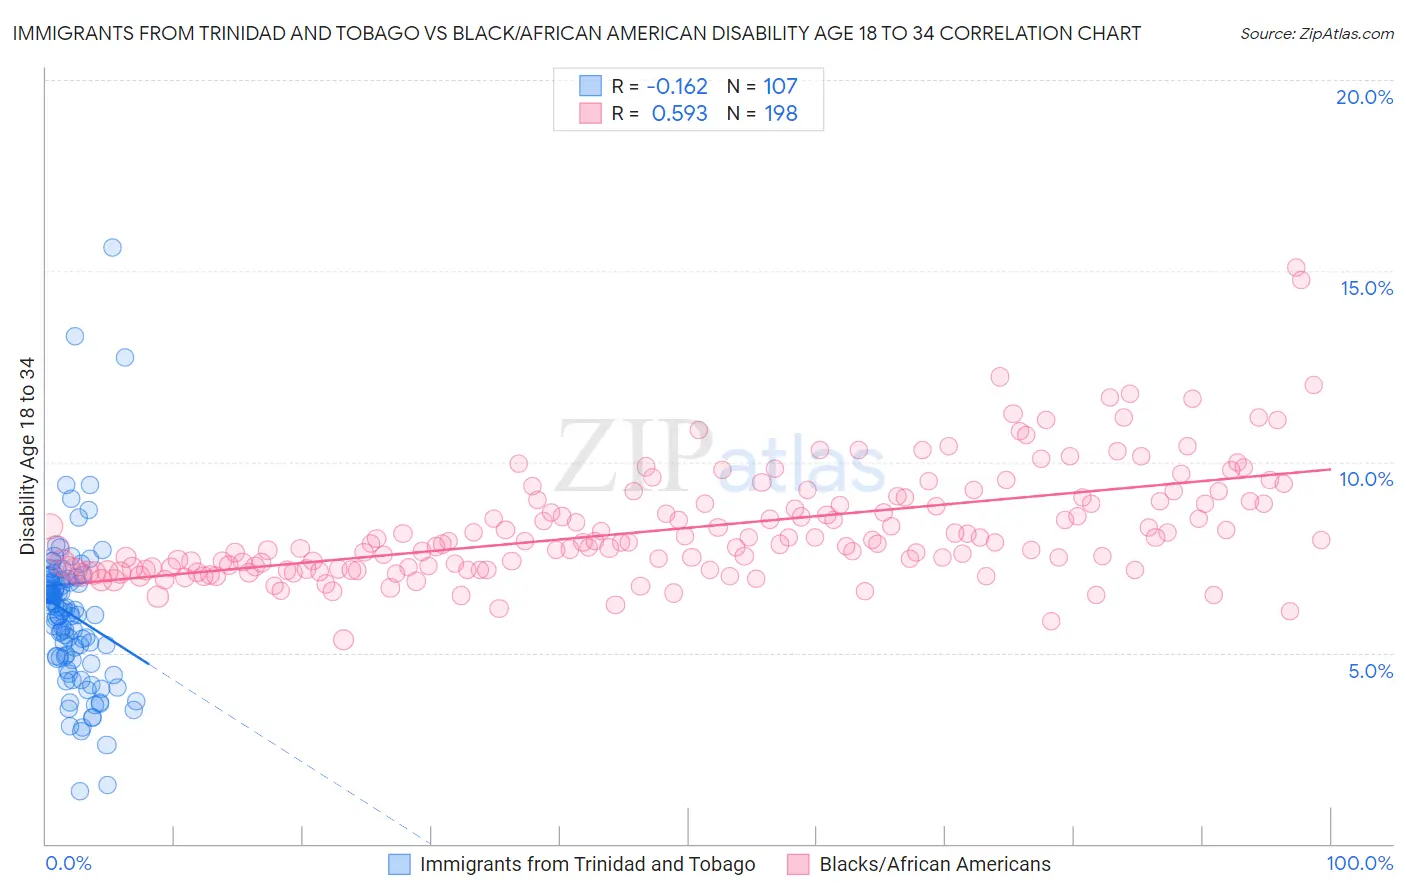
Immigrants from Trinidad and Tobago vs Black/African American Disability Age 18 to 34 Correlation Chart
The statistical analysis conducted on geographies consisting of 223,304,985 people shows a poor negative correlation between the proportion of Immigrants from Trinidad and Tobago and percentage of population with a disability between the ages 18 and 35 in the United States with a correlation coefficient (R) of -0.162 and weighted average of 5.9%. Similarly, the statistical analysis conducted on geographies consisting of 561,495,678 people shows a substantial positive correlation between the proportion of Blacks/African Americans and percentage of population with a disability between the ages 18 and 35 in the United States with a correlation coefficient (R) of 0.593 and weighted average of 7.7%, a difference of 30.0%.
Disability Age 18 to 34 Correlation Summary
| Measurement | Immigrants from Trinidad and Tobago | Black/African American |
| Minimum | 1.4% | 5.3% |
| Maximum | 15.6% | 15.1% |
| Range | 14.2% | 9.7% |
| Mean | 6.0% | 8.3% |
| Median | 6.0% | 7.9% |
| Interquartile 25% (IQ1) | 4.8% | 7.2% |
| Interquartile 75% (IQ3) | 6.8% | 9.0% |
| Interquartile Range (IQR) | 2.0% | 1.8% |
| Standard Deviation (Sample) | 2.1% | 1.5% |
| Standard Deviation (Population) | 2.1% | 1.5% |
Similar Demographics by Disability Age 18 to 34
Demographics Similar to Immigrants from Trinidad and Tobago by Disability Age 18 to 34
In terms of disability age 18 to 34, the demographic groups most similar to Immigrants from Trinidad and Tobago are Immigrants from Belarus (5.9%, a difference of 0.10%), Immigrants from El Salvador (5.9%, a difference of 0.14%), Egyptian (5.9%, a difference of 0.14%), Okinawan (5.9%, a difference of 0.28%), and Immigrants from Egypt (5.9%, a difference of 0.42%).
| Demographics | Rating | Rank | Disability Age 18 to 34 |
| Nicaraguans | 99.9 /100 | #41 | Exceptional 5.8% |
| Colombians | 99.8 /100 | #42 | Exceptional 5.9% |
| South Americans | 99.8 /100 | #43 | Exceptional 5.9% |
| Immigrants | Asia | 99.8 /100 | #44 | Exceptional 5.9% |
| Immigrants | Peru | 99.8 /100 | #45 | Exceptional 5.9% |
| Immigrants | Korea | 99.8 /100 | #46 | Exceptional 5.9% |
| Immigrants | Egypt | 99.8 /100 | #47 | Exceptional 5.9% |
| Immigrants | Trinidad and Tobago | 99.8 /100 | #48 | Exceptional 5.9% |
| Immigrants | Belarus | 99.8 /100 | #49 | Exceptional 5.9% |
| Immigrants | El Salvador | 99.8 /100 | #50 | Exceptional 5.9% |
| Egyptians | 99.8 /100 | #51 | Exceptional 5.9% |
| Okinawans | 99.7 /100 | #52 | Exceptional 5.9% |
| Immigrants | Indonesia | 99.7 /100 | #53 | Exceptional 5.9% |
| Immigrants | Malaysia | 99.7 /100 | #54 | Exceptional 5.9% |
| Immigrants | Spain | 99.7 /100 | #55 | Exceptional 5.9% |
Demographics Similar to Blacks/African Americans by Disability Age 18 to 34
In terms of disability age 18 to 34, the demographic groups most similar to Blacks/African Americans are Scandinavian (7.7%, a difference of 0.060%), Immigrants from Cabo Verde (7.7%, a difference of 0.21%), Irish (7.7%, a difference of 0.22%), Tlingit-Haida (7.7%, a difference of 0.22%), and Slovak (7.7%, a difference of 0.27%).
| Demographics | Rating | Rank | Disability Age 18 to 34 |
| Swedes | 0.0 /100 | #285 | Tragic 7.5% |
| Celtics | 0.0 /100 | #286 | Tragic 7.6% |
| Norwegians | 0.0 /100 | #287 | Tragic 7.6% |
| Whites/Caucasians | 0.0 /100 | #288 | Tragic 7.6% |
| Immigrants | Nonimmigrants | 0.0 /100 | #289 | Tragic 7.6% |
| Slovaks | 0.0 /100 | #290 | Tragic 7.7% |
| Irish | 0.0 /100 | #291 | Tragic 7.7% |
| Blacks/African Americans | 0.0 /100 | #292 | Tragic 7.7% |
| Scandinavians | 0.0 /100 | #293 | Tragic 7.7% |
| Immigrants | Cabo Verde | 0.0 /100 | #294 | Tragic 7.7% |
| Tlingit-Haida | 0.0 /100 | #295 | Tragic 7.7% |
| Cape Verdeans | 0.0 /100 | #296 | Tragic 7.7% |
| Pueblo | 0.0 /100 | #297 | Tragic 7.7% |
| Dutch | 0.0 /100 | #298 | Tragic 7.7% |
| Germans | 0.0 /100 | #299 | Tragic 7.7% |