Immigrants from Trinidad and Tobago vs Immigrants from Hong Kong Single Father Households
COMPARE
Immigrants from Trinidad and Tobago
Immigrants from Hong Kong
Single Father Households
Single Father Households Comparison
Immigrants from Trinidad and Tobago
Immigrants from Hong Kong
2.2%
SINGLE FATHER HOUSEHOLDS
98.2/ 100
METRIC RATING
112th/ 347
METRIC RANK
1.8%
SINGLE FATHER HOUSEHOLDS
100.0/ 100
METRIC RATING
5th/ 347
METRIC RANK
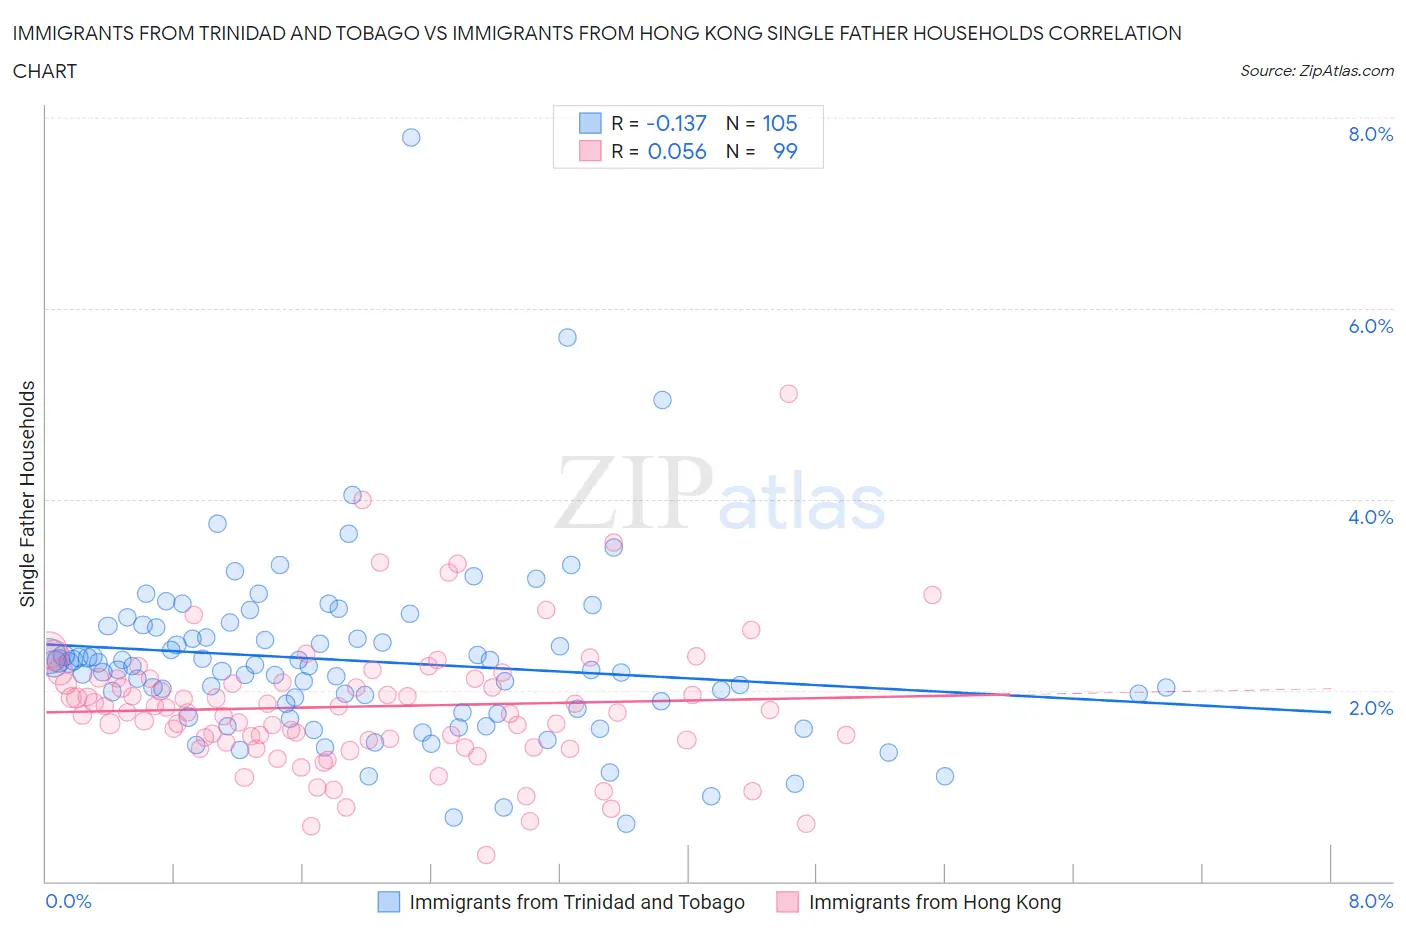
Immigrants from Trinidad and Tobago vs Immigrants from Hong Kong Single Father Households Correlation Chart
The statistical analysis conducted on geographies consisting of 222,523,327 people shows a poor negative correlation between the proportion of Immigrants from Trinidad and Tobago and percentage of single father households in the United States with a correlation coefficient (R) of -0.137 and weighted average of 2.2%. Similarly, the statistical analysis conducted on geographies consisting of 252,470,296 people shows a slight positive correlation between the proportion of Immigrants from Hong Kong and percentage of single father households in the United States with a correlation coefficient (R) of 0.056 and weighted average of 1.8%, a difference of 18.2%.
Single Father Households Correlation Summary
| Measurement | Immigrants from Trinidad and Tobago | Immigrants from Hong Kong |
| Minimum | 0.61% | 0.28% |
| Maximum | 7.8% | 5.1% |
| Range | 7.2% | 4.8% |
| Mean | 2.3% | 1.8% |
| Median | 2.2% | 1.8% |
| Interquartile 25% (IQ1) | 1.8% | 1.4% |
| Interquartile 75% (IQ3) | 2.6% | 2.1% |
| Interquartile Range (IQR) | 0.82% | 0.67% |
| Standard Deviation (Sample) | 0.95% | 0.72% |
| Standard Deviation (Population) | 0.95% | 0.71% |
Similar Demographics by Single Father Households
Demographics Similar to Immigrants from Trinidad and Tobago by Single Father Households
In terms of single father households, the demographic groups most similar to Immigrants from Trinidad and Tobago are Iraqi (2.2%, a difference of 0.010%), Immigrants from Canada (2.2%, a difference of 0.040%), Immigrants from North America (2.2%, a difference of 0.060%), Immigrants from Barbados (2.2%, a difference of 0.090%), and Immigrants from Argentina (2.2%, a difference of 0.11%).
| Demographics | Rating | Rank | Single Father Households |
| Palestinians | 98.6 /100 | #105 | Exceptional 2.2% |
| Immigrants | Southern Europe | 98.6 /100 | #106 | Exceptional 2.2% |
| Slovenes | 98.5 /100 | #107 | Exceptional 2.2% |
| Immigrants | Netherlands | 98.5 /100 | #108 | Exceptional 2.2% |
| Barbadians | 98.4 /100 | #109 | Exceptional 2.2% |
| Italians | 98.3 /100 | #110 | Exceptional 2.2% |
| Immigrants | Canada | 98.3 /100 | #111 | Exceptional 2.2% |
| Immigrants | Trinidad and Tobago | 98.2 /100 | #112 | Exceptional 2.2% |
| Iraqis | 98.2 /100 | #113 | Exceptional 2.2% |
| Immigrants | North America | 98.2 /100 | #114 | Exceptional 2.2% |
| Immigrants | Barbados | 98.2 /100 | #115 | Exceptional 2.2% |
| Immigrants | Argentina | 98.1 /100 | #116 | Exceptional 2.2% |
| Hungarians | 97.9 /100 | #117 | Exceptional 2.2% |
| Immigrants | Morocco | 97.8 /100 | #118 | Exceptional 2.2% |
| Trinidadians and Tobagonians | 97.8 /100 | #119 | Exceptional 2.2% |
Demographics Similar to Immigrants from Hong Kong by Single Father Households
In terms of single father households, the demographic groups most similar to Immigrants from Hong Kong are Immigrants from Taiwan (1.8%, a difference of 0.37%), Cypriot (1.8%, a difference of 0.52%), Immigrants from Ireland (1.8%, a difference of 0.63%), Immigrants from China (1.8%, a difference of 0.77%), and Immigrants from Uzbekistan (1.8%, a difference of 0.94%).
| Demographics | Rating | Rank | Single Father Households |
| Soviet Union | 100.0 /100 | #1 | Exceptional 1.8% |
| Immigrants | Israel | 100.0 /100 | #2 | Exceptional 1.8% |
| Filipinos | 100.0 /100 | #3 | Exceptional 1.8% |
| Immigrants | Uzbekistan | 100.0 /100 | #4 | Exceptional 1.8% |
| Immigrants | Hong Kong | 100.0 /100 | #5 | Exceptional 1.8% |
| Immigrants | Taiwan | 100.0 /100 | #6 | Exceptional 1.8% |
| Cypriots | 100.0 /100 | #7 | Exceptional 1.8% |
| Immigrants | Ireland | 100.0 /100 | #8 | Exceptional 1.8% |
| Immigrants | China | 100.0 /100 | #9 | Exceptional 1.8% |
| Okinawans | 100.0 /100 | #10 | Exceptional 1.9% |
| Immigrants | Belarus | 100.0 /100 | #11 | Exceptional 1.9% |
| Immigrants | Greece | 100.0 /100 | #12 | Exceptional 1.9% |
| Immigrants | Singapore | 100.0 /100 | #13 | Exceptional 1.9% |
| Immigrants | Lithuania | 100.0 /100 | #14 | Exceptional 1.9% |
| Immigrants | Eastern Asia | 100.0 /100 | #15 | Exceptional 1.9% |