Immigrants from Taiwan vs Navajo Divorced or Separated
COMPARE
Immigrants from Taiwan
Navajo
Divorced or Separated
Divorced or Separated Comparison
Immigrants from Taiwan
Navajo
9.8%
DIVORCED OR SEPARATED
100.0/ 100
METRIC RATING
1st/ 347
METRIC RANK
12.0%
DIVORCED OR SEPARATED
63.9/ 100
METRIC RATING
163rd/ 347
METRIC RANK
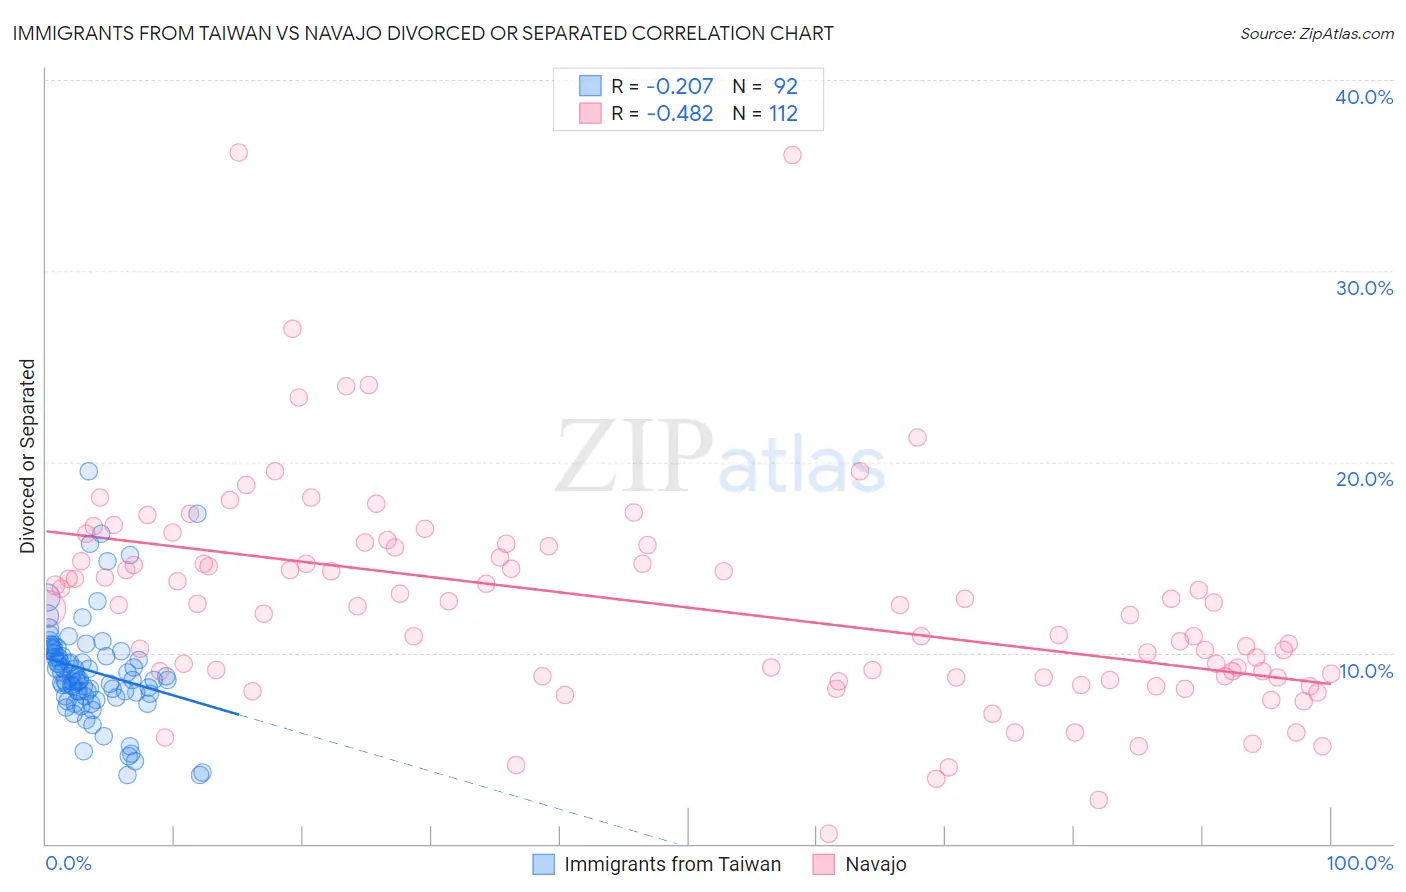
Immigrants from Taiwan vs Navajo Divorced or Separated Correlation Chart
The statistical analysis conducted on geographies consisting of 298,143,360 people shows a weak negative correlation between the proportion of Immigrants from Taiwan and percentage of population currently divorced or separated in the United States with a correlation coefficient (R) of -0.207 and weighted average of 9.8%. Similarly, the statistical analysis conducted on geographies consisting of 224,845,032 people shows a moderate negative correlation between the proportion of Navajo and percentage of population currently divorced or separated in the United States with a correlation coefficient (R) of -0.482 and weighted average of 12.0%, a difference of 22.3%.
Divorced or Separated Correlation Summary
| Measurement | Immigrants from Taiwan | Navajo |
| Minimum | 3.6% | 0.50% |
| Maximum | 19.5% | 36.2% |
| Range | 15.9% | 35.7% |
| Mean | 9.0% | 12.5% |
| Median | 8.6% | 12.5% |
| Interquartile 25% (IQ1) | 7.8% | 8.7% |
| Interquartile 75% (IQ3) | 10.0% | 15.2% |
| Interquartile Range (IQR) | 2.2% | 6.5% |
| Standard Deviation (Sample) | 2.7% | 5.7% |
| Standard Deviation (Population) | 2.7% | 5.7% |
Similar Demographics by Divorced or Separated
Demographics Similar to Immigrants from Taiwan by Divorced or Separated
In terms of divorced or separated, the demographic groups most similar to Immigrants from Taiwan are Filipino (9.9%, a difference of 1.1%), Immigrants from Hong Kong (10.0%, a difference of 1.6%), Immigrants from China (10.0%, a difference of 2.4%), Immigrants from India (10.1%, a difference of 2.6%), and Indian (Asian) (10.2%, a difference of 4.0%).
| Demographics | Rating | Rank | Divorced or Separated |
| Immigrants | Taiwan | 100.0 /100 | #1 | Exceptional 9.8% |
| Filipinos | 100.0 /100 | #2 | Exceptional 9.9% |
| Immigrants | Hong Kong | 100.0 /100 | #3 | Exceptional 10.0% |
| Immigrants | China | 100.0 /100 | #4 | Exceptional 10.0% |
| Immigrants | India | 100.0 /100 | #5 | Exceptional 10.1% |
| Indians (Asian) | 100.0 /100 | #6 | Exceptional 10.2% |
| Thais | 100.0 /100 | #7 | Exceptional 10.2% |
| Immigrants | Eastern Asia | 100.0 /100 | #8 | Exceptional 10.2% |
| Yup'ik | 100.0 /100 | #9 | Exceptional 10.3% |
| Immigrants | Singapore | 100.0 /100 | #10 | Exceptional 10.3% |
| Immigrants | South Central Asia | 100.0 /100 | #11 | Exceptional 10.4% |
| Okinawans | 100.0 /100 | #12 | Exceptional 10.5% |
| Cypriots | 100.0 /100 | #13 | Exceptional 10.5% |
| Assyrians/Chaldeans/Syriacs | 100.0 /100 | #14 | Exceptional 10.6% |
| Immigrants | Armenia | 100.0 /100 | #15 | Exceptional 10.6% |
Demographics Similar to Navajo by Divorced or Separated
In terms of divorced or separated, the demographic groups most similar to Navajo are Samoan (12.0%, a difference of 0.010%), Swiss (12.0%, a difference of 0.010%), Marshallese (12.0%, a difference of 0.030%), Immigrants from Scotland (12.0%, a difference of 0.070%), and Icelander (12.0%, a difference of 0.080%).
| Demographics | Rating | Rank | Divorced or Separated |
| Hungarians | 70.3 /100 | #156 | Good 12.0% |
| Immigrants | Brazil | 68.8 /100 | #157 | Good 12.0% |
| Icelanders | 66.0 /100 | #158 | Good 12.0% |
| Immigrants | Barbados | 66.0 /100 | #159 | Good 12.0% |
| Immigrants | Scotland | 65.8 /100 | #160 | Good 12.0% |
| Marshallese | 64.6 /100 | #161 | Good 12.0% |
| Samoans | 64.3 /100 | #162 | Good 12.0% |
| Navajo | 63.9 /100 | #163 | Good 12.0% |
| Swiss | 63.6 /100 | #164 | Good 12.0% |
| German Russians | 61.8 /100 | #165 | Good 12.0% |
| Tohono O'odham | 60.4 /100 | #166 | Good 12.0% |
| Ethiopians | 58.5 /100 | #167 | Average 12.0% |
| Serbians | 57.1 /100 | #168 | Average 12.0% |
| Immigrants | Peru | 57.0 /100 | #169 | Average 12.0% |
| Mexican American Indians | 55.8 /100 | #170 | Average 12.0% |