Immigrants from Sri Lanka vs Slovak Births to Unmarried Women
COMPARE
Immigrants from Sri Lanka
Slovak
Births to Unmarried Women
Births to Unmarried Women Comparison
Immigrants from Sri Lanka
Slovaks
27.2%
BIRTHS TO UNMARRIED WOMEN
99.8/ 100
METRIC RATING
33rd/ 347
METRIC RANK
33.4%
BIRTHS TO UNMARRIED WOMEN
9.3/ 100
METRIC RATING
214th/ 347
METRIC RANK
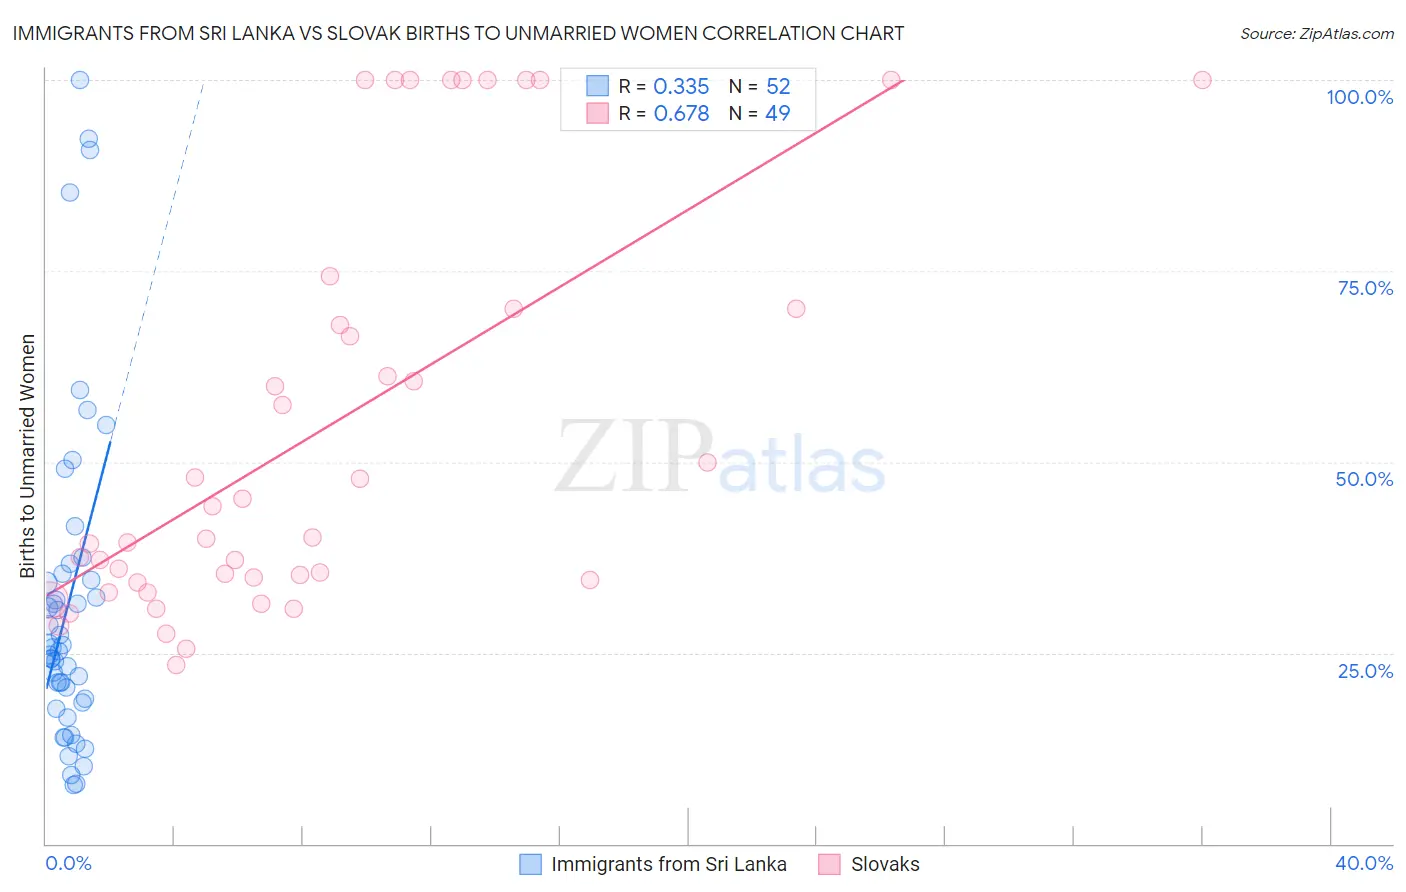
Immigrants from Sri Lanka vs Slovak Births to Unmarried Women Correlation Chart
The statistical analysis conducted on geographies consisting of 143,925,321 people shows a mild positive correlation between the proportion of Immigrants from Sri Lanka and percentage of births to unmarried women in the United States with a correlation coefficient (R) of 0.335 and weighted average of 27.2%. Similarly, the statistical analysis conducted on geographies consisting of 364,615,569 people shows a significant positive correlation between the proportion of Slovaks and percentage of births to unmarried women in the United States with a correlation coefficient (R) of 0.678 and weighted average of 33.4%, a difference of 22.9%.
Births to Unmarried Women Correlation Summary
| Measurement | Immigrants from Sri Lanka | Slovak |
| Minimum | 7.7% | 23.4% |
| Maximum | 100.0% | 100.0% |
| Range | 92.3% | 76.6% |
| Mean | 31.5% | 54.4% |
| Median | 25.5% | 40.0% |
| Interquartile 25% (IQ1) | 18.7% | 34.4% |
| Interquartile 75% (IQ3) | 34.9% | 70.0% |
| Interquartile Range (IQR) | 16.2% | 35.6% |
| Standard Deviation (Sample) | 21.5% | 26.5% |
| Standard Deviation (Population) | 21.3% | 26.2% |
Similar Demographics by Births to Unmarried Women
Demographics Similar to Immigrants from Sri Lanka by Births to Unmarried Women
In terms of births to unmarried women, the demographic groups most similar to Immigrants from Sri Lanka are Immigrants from Pakistan (27.2%, a difference of 0.040%), Immigrants from Russia (27.1%, a difference of 0.070%), Immigrants from Iraq (27.1%, a difference of 0.10%), Immigrants from Ireland (27.2%, a difference of 0.12%), and Immigrants from Western Asia (27.2%, a difference of 0.19%).
| Demographics | Rating | Rank | Births to Unmarried Women |
| Asians | 99.9 /100 | #26 | Exceptional 26.8% |
| Immigrants | Asia | 99.9 /100 | #27 | Exceptional 26.8% |
| Okinawans | 99.8 /100 | #28 | Exceptional 26.9% |
| Cypriots | 99.8 /100 | #29 | Exceptional 27.0% |
| Bulgarians | 99.8 /100 | #30 | Exceptional 27.1% |
| Immigrants | Iraq | 99.8 /100 | #31 | Exceptional 27.1% |
| Immigrants | Russia | 99.8 /100 | #32 | Exceptional 27.1% |
| Immigrants | Sri Lanka | 99.8 /100 | #33 | Exceptional 27.2% |
| Immigrants | Pakistan | 99.8 /100 | #34 | Exceptional 27.2% |
| Immigrants | Ireland | 99.7 /100 | #35 | Exceptional 27.2% |
| Immigrants | Western Asia | 99.7 /100 | #36 | Exceptional 27.2% |
| Immigrants | Ukraine | 99.7 /100 | #37 | Exceptional 27.2% |
| Immigrants | Moldova | 99.7 /100 | #38 | Exceptional 27.3% |
| Immigrants | Malaysia | 99.7 /100 | #39 | Exceptional 27.4% |
| Turks | 99.6 /100 | #40 | Exceptional 27.4% |
Demographics Similar to Slovaks by Births to Unmarried Women
In terms of births to unmarried women, the demographic groups most similar to Slovaks are Immigrants from Costa Rica (33.4%, a difference of 0.050%), French (33.4%, a difference of 0.18%), Celtic (33.3%, a difference of 0.24%), Ecuadorian (33.3%, a difference of 0.30%), and White/Caucasian (33.3%, a difference of 0.35%).
| Demographics | Rating | Rank | Births to Unmarried Women |
| Immigrants | Sudan | 11.5 /100 | #207 | Poor 33.2% |
| Hawaiians | 11.3 /100 | #208 | Poor 33.2% |
| Whites/Caucasians | 10.7 /100 | #209 | Poor 33.3% |
| Scotch-Irish | 10.7 /100 | #210 | Poor 33.3% |
| Ecuadorians | 10.5 /100 | #211 | Poor 33.3% |
| Celtics | 10.2 /100 | #212 | Poor 33.3% |
| Immigrants | Costa Rica | 9.5 /100 | #213 | Tragic 33.4% |
| Slovaks | 9.3 /100 | #214 | Tragic 33.4% |
| French | 8.7 /100 | #215 | Tragic 33.4% |
| Nepalese | 7.8 /100 | #216 | Tragic 33.5% |
| Spaniards | 7.0 /100 | #217 | Tragic 33.6% |
| Immigrants | Ecuador | 5.9 /100 | #218 | Tragic 33.7% |
| Alsatians | 5.4 /100 | #219 | Tragic 33.8% |
| Portuguese | 5.4 /100 | #220 | Tragic 33.8% |
| Malaysians | 5.0 /100 | #221 | Tragic 33.9% |