Bangladeshi vs Slovak Births to Unmarried Women
COMPARE
Bangladeshi
Slovak
Births to Unmarried Women
Births to Unmarried Women Comparison
Bangladeshis
Slovaks
34.4%
BIRTHS TO UNMARRIED WOMEN
2.5/ 100
METRIC RATING
233rd/ 347
METRIC RANK
33.4%
BIRTHS TO UNMARRIED WOMEN
9.3/ 100
METRIC RATING
214th/ 347
METRIC RANK
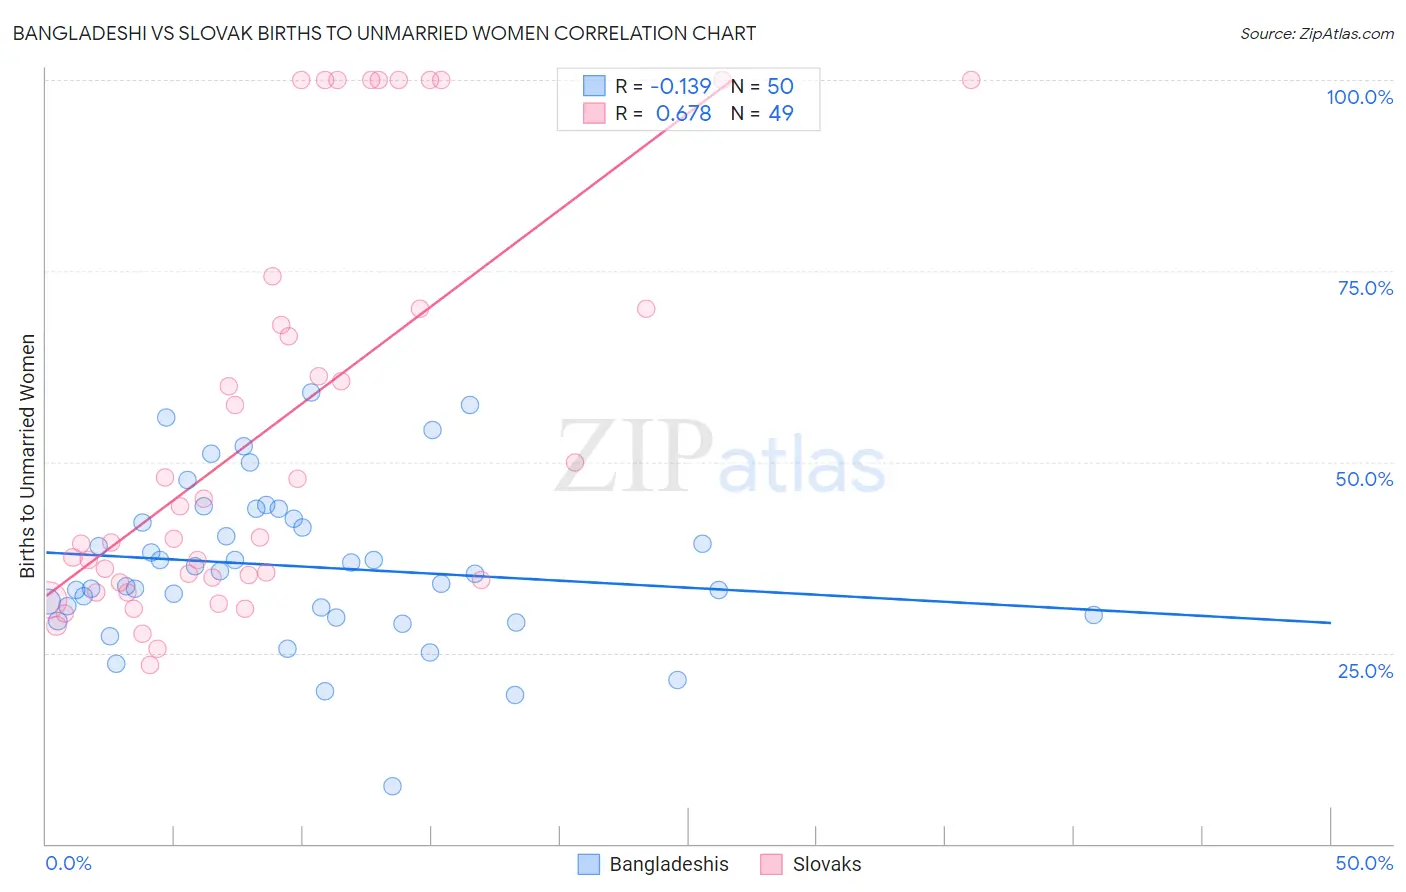
Bangladeshi vs Slovak Births to Unmarried Women Correlation Chart
The statistical analysis conducted on geographies consisting of 137,729,923 people shows a poor negative correlation between the proportion of Bangladeshis and percentage of births to unmarried women in the United States with a correlation coefficient (R) of -0.139 and weighted average of 34.4%. Similarly, the statistical analysis conducted on geographies consisting of 364,615,569 people shows a significant positive correlation between the proportion of Slovaks and percentage of births to unmarried women in the United States with a correlation coefficient (R) of 0.678 and weighted average of 33.4%, a difference of 3.1%.
Births to Unmarried Women Correlation Summary
| Measurement | Bangladeshi | Slovak |
| Minimum | 7.6% | 23.4% |
| Maximum | 59.1% | 100.0% |
| Range | 51.5% | 76.6% |
| Mean | 36.4% | 54.4% |
| Median | 35.5% | 40.0% |
| Interquartile 25% (IQ1) | 30.0% | 34.4% |
| Interquartile 75% (IQ3) | 42.6% | 70.0% |
| Interquartile Range (IQR) | 12.6% | 35.6% |
| Standard Deviation (Sample) | 10.4% | 26.5% |
| Standard Deviation (Population) | 10.3% | 26.2% |
Demographics Similar to Bangladeshis and Slovaks by Births to Unmarried Women
In terms of births to unmarried women, the demographic groups most similar to Bangladeshis are French Canadian (34.4%, a difference of 0.020%), Native Hawaiian (34.3%, a difference of 0.31%), Ghanaian (34.3%, a difference of 0.46%), Immigrants from Sierra Leone (34.2%, a difference of 0.48%), and Panamanian (34.2%, a difference of 0.59%). Similarly, the demographic groups most similar to Slovaks are Immigrants from Costa Rica (33.4%, a difference of 0.050%), French (33.4%, a difference of 0.18%), Nepalese (33.5%, a difference of 0.45%), Spaniard (33.6%, a difference of 0.69%), and Immigrants from Ecuador (33.7%, a difference of 1.1%).
| Demographics | Rating | Rank | Births to Unmarried Women |
| Immigrants | Costa Rica | 9.5 /100 | #213 | Tragic 33.4% |
| Slovaks | 9.3 /100 | #214 | Tragic 33.4% |
| French | 8.7 /100 | #215 | Tragic 33.4% |
| Nepalese | 7.8 /100 | #216 | Tragic 33.5% |
| Spaniards | 7.0 /100 | #217 | Tragic 33.6% |
| Immigrants | Ecuador | 5.9 /100 | #218 | Tragic 33.7% |
| Alsatians | 5.4 /100 | #219 | Tragic 33.8% |
| Portuguese | 5.4 /100 | #220 | Tragic 33.8% |
| Malaysians | 5.0 /100 | #221 | Tragic 33.9% |
| Immigrants | Uruguay | 4.8 /100 | #222 | Tragic 33.9% |
| Pennsylvania Germans | 4.3 /100 | #223 | Tragic 34.0% |
| Immigrants | Laos | 4.3 /100 | #224 | Tragic 34.0% |
| Spanish | 4.0 /100 | #225 | Tragic 34.1% |
| Delaware | 3.3 /100 | #226 | Tragic 34.2% |
| Immigrants | Panama | 3.3 /100 | #227 | Tragic 34.2% |
| Panamanians | 3.3 /100 | #228 | Tragic 34.2% |
| Immigrants | Sierra Leone | 3.1 /100 | #229 | Tragic 34.2% |
| Ghanaians | 3.1 /100 | #230 | Tragic 34.3% |
| Native Hawaiians | 2.9 /100 | #231 | Tragic 34.3% |
| French Canadians | 2.5 /100 | #232 | Tragic 34.4% |
| Bangladeshis | 2.5 /100 | #233 | Tragic 34.4% |