Immigrants from Sri Lanka vs Assyrian/Chaldean/Syriac Single Mother Households
COMPARE
Immigrants from Sri Lanka
Assyrian/Chaldean/Syriac
Single Mother Households
Single Mother Households Comparison
Immigrants from Sri Lanka
Assyrians/Chaldeans/Syriacs
5.6%
SINGLE MOTHER HOUSEHOLDS
98.0/ 100
METRIC RATING
79th/ 347
METRIC RANK
4.8%
SINGLE MOTHER HOUSEHOLDS
100.0/ 100
METRIC RATING
4th/ 347
METRIC RANK
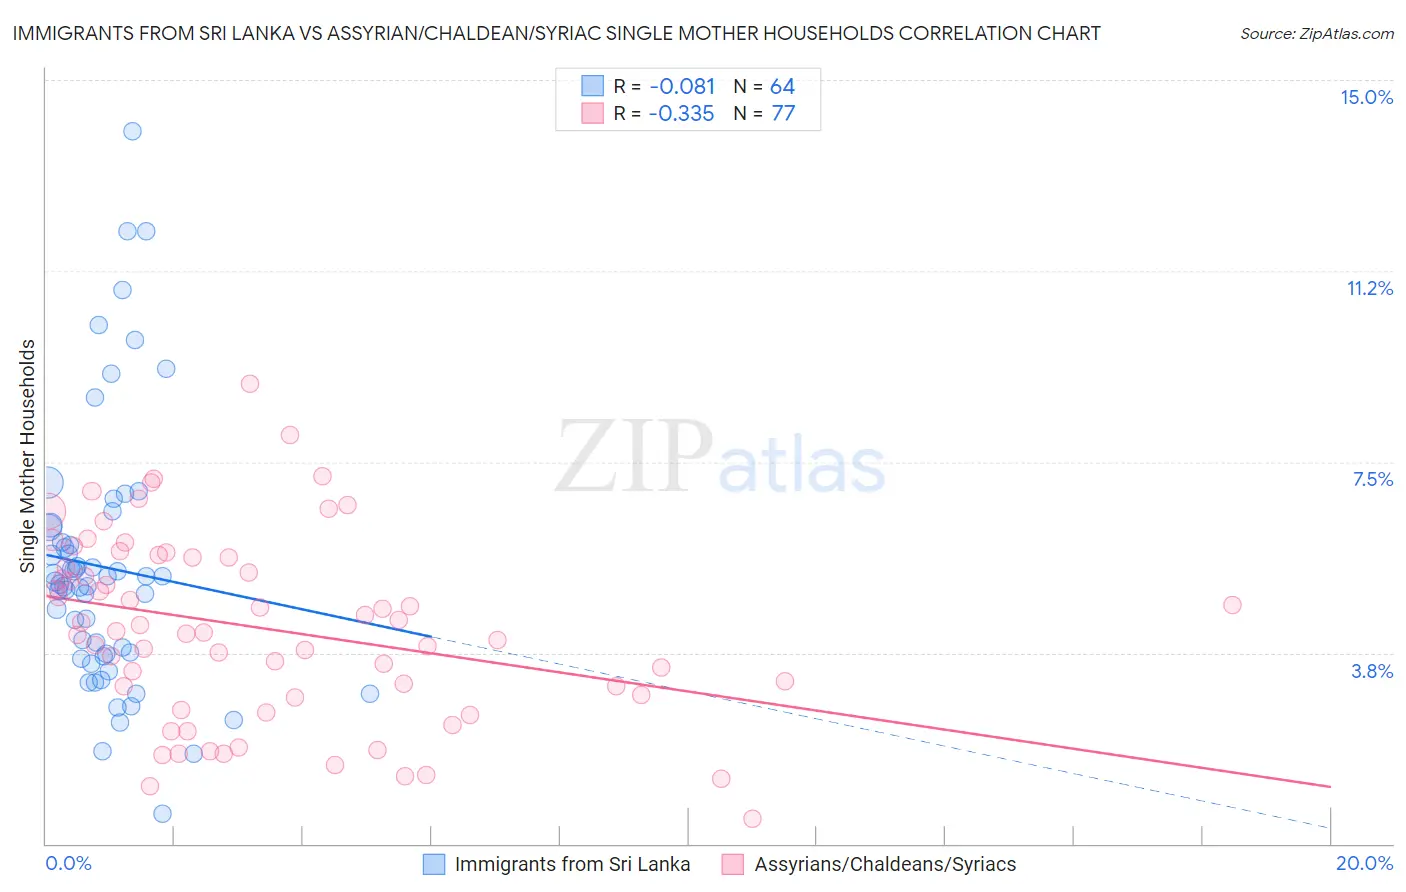
Immigrants from Sri Lanka vs Assyrian/Chaldean/Syriac Single Mother Households Correlation Chart
The statistical analysis conducted on geographies consisting of 149,613,913 people shows a slight negative correlation between the proportion of Immigrants from Sri Lanka and percentage of single mother households in the United States with a correlation coefficient (R) of -0.081 and weighted average of 5.6%. Similarly, the statistical analysis conducted on geographies consisting of 110,241,669 people shows a mild negative correlation between the proportion of Assyrians/Chaldeans/Syriacs and percentage of single mother households in the United States with a correlation coefficient (R) of -0.335 and weighted average of 4.8%, a difference of 17.2%.
Single Mother Households Correlation Summary
| Measurement | Immigrants from Sri Lanka | Assyrian/Chaldean/Syriac |
| Minimum | 0.60% | 0.50% |
| Maximum | 14.0% | 9.0% |
| Range | 13.4% | 8.5% |
| Mean | 5.4% | 4.2% |
| Median | 5.1% | 4.2% |
| Interquartile 25% (IQ1) | 3.7% | 2.9% |
| Interquartile 75% (IQ3) | 6.1% | 5.6% |
| Interquartile Range (IQR) | 2.4% | 2.7% |
| Standard Deviation (Sample) | 2.6% | 1.8% |
| Standard Deviation (Population) | 2.6% | 1.8% |
Similar Demographics by Single Mother Households
Demographics Similar to Immigrants from Sri Lanka by Single Mother Households
In terms of single mother households, the demographic groups most similar to Immigrants from Sri Lanka are Czech (5.6%, a difference of 0.11%), Immigrants from Moldova (5.6%, a difference of 0.11%), Swiss (5.6%, a difference of 0.20%), Romanian (5.6%, a difference of 0.21%), and Immigrants from Malaysia (5.7%, a difference of 0.32%).
| Demographics | Rating | Rank | Single Mother Households |
| Immigrants | Netherlands | 98.4 /100 | #72 | Exceptional 5.6% |
| Immigrants | Asia | 98.4 /100 | #73 | Exceptional 5.6% |
| Immigrants | North America | 98.3 /100 | #74 | Exceptional 5.6% |
| Slovenes | 98.3 /100 | #75 | Exceptional 5.6% |
| New Zealanders | 98.2 /100 | #76 | Exceptional 5.6% |
| Romanians | 98.1 /100 | #77 | Exceptional 5.6% |
| Swiss | 98.1 /100 | #78 | Exceptional 5.6% |
| Immigrants | Sri Lanka | 98.0 /100 | #79 | Exceptional 5.6% |
| Czechs | 97.9 /100 | #80 | Exceptional 5.6% |
| Immigrants | Moldova | 97.9 /100 | #81 | Exceptional 5.6% |
| Immigrants | Malaysia | 97.8 /100 | #82 | Exceptional 5.7% |
| Immigrants | Hungary | 97.8 /100 | #83 | Exceptional 5.7% |
| Carpatho Rusyns | 97.7 /100 | #84 | Exceptional 5.7% |
| Hungarians | 97.6 /100 | #85 | Exceptional 5.7% |
| Finns | 97.6 /100 | #86 | Exceptional 5.7% |
Demographics Similar to Assyrians/Chaldeans/Syriacs by Single Mother Households
In terms of single mother households, the demographic groups most similar to Assyrians/Chaldeans/Syriacs are Immigrants from Iran (4.8%, a difference of 0.080%), Immigrants from Hong Kong (4.8%, a difference of 0.52%), Filipino (4.7%, a difference of 2.4%), Immigrants from Taiwan (4.7%, a difference of 2.7%), and Immigrants from Singapore (5.0%, a difference of 3.1%).
| Demographics | Rating | Rank | Single Mother Households |
| Immigrants | Taiwan | 100.0 /100 | #1 | Exceptional 4.7% |
| Filipinos | 100.0 /100 | #2 | Exceptional 4.7% |
| Immigrants | Iran | 100.0 /100 | #3 | Exceptional 4.8% |
| Assyrians/Chaldeans/Syriacs | 100.0 /100 | #4 | Exceptional 4.8% |
| Immigrants | Hong Kong | 100.0 /100 | #5 | Exceptional 4.8% |
| Immigrants | Singapore | 100.0 /100 | #6 | Exceptional 5.0% |
| Iranians | 100.0 /100 | #7 | Exceptional 5.0% |
| Immigrants | Ireland | 99.9 /100 | #8 | Exceptional 5.0% |
| Okinawans | 99.9 /100 | #9 | Exceptional 5.0% |
| Immigrants | Israel | 99.9 /100 | #10 | Exceptional 5.0% |
| Immigrants | China | 99.9 /100 | #11 | Exceptional 5.1% |
| Cypriots | 99.9 /100 | #12 | Exceptional 5.1% |
| Immigrants | India | 99.9 /100 | #13 | Exceptional 5.1% |
| Immigrants | Australia | 99.9 /100 | #14 | Exceptional 5.1% |
| Immigrants | Eastern Asia | 99.9 /100 | #15 | Exceptional 5.1% |