Immigrants from South Eastern Asia vs Immigrants from El Salvador Single Mother Households
COMPARE
Immigrants from South Eastern Asia
Immigrants from El Salvador
Single Mother Households
Single Mother Households Comparison
Immigrants from South Eastern Asia
Immigrants from El Salvador
6.3%
SINGLE MOTHER HOUSEHOLDS
52.2/ 100
METRIC RATING
172nd/ 347
METRIC RANK
7.6%
SINGLE MOTHER HOUSEHOLDS
0.0/ 100
METRIC RATING
279th/ 347
METRIC RANK
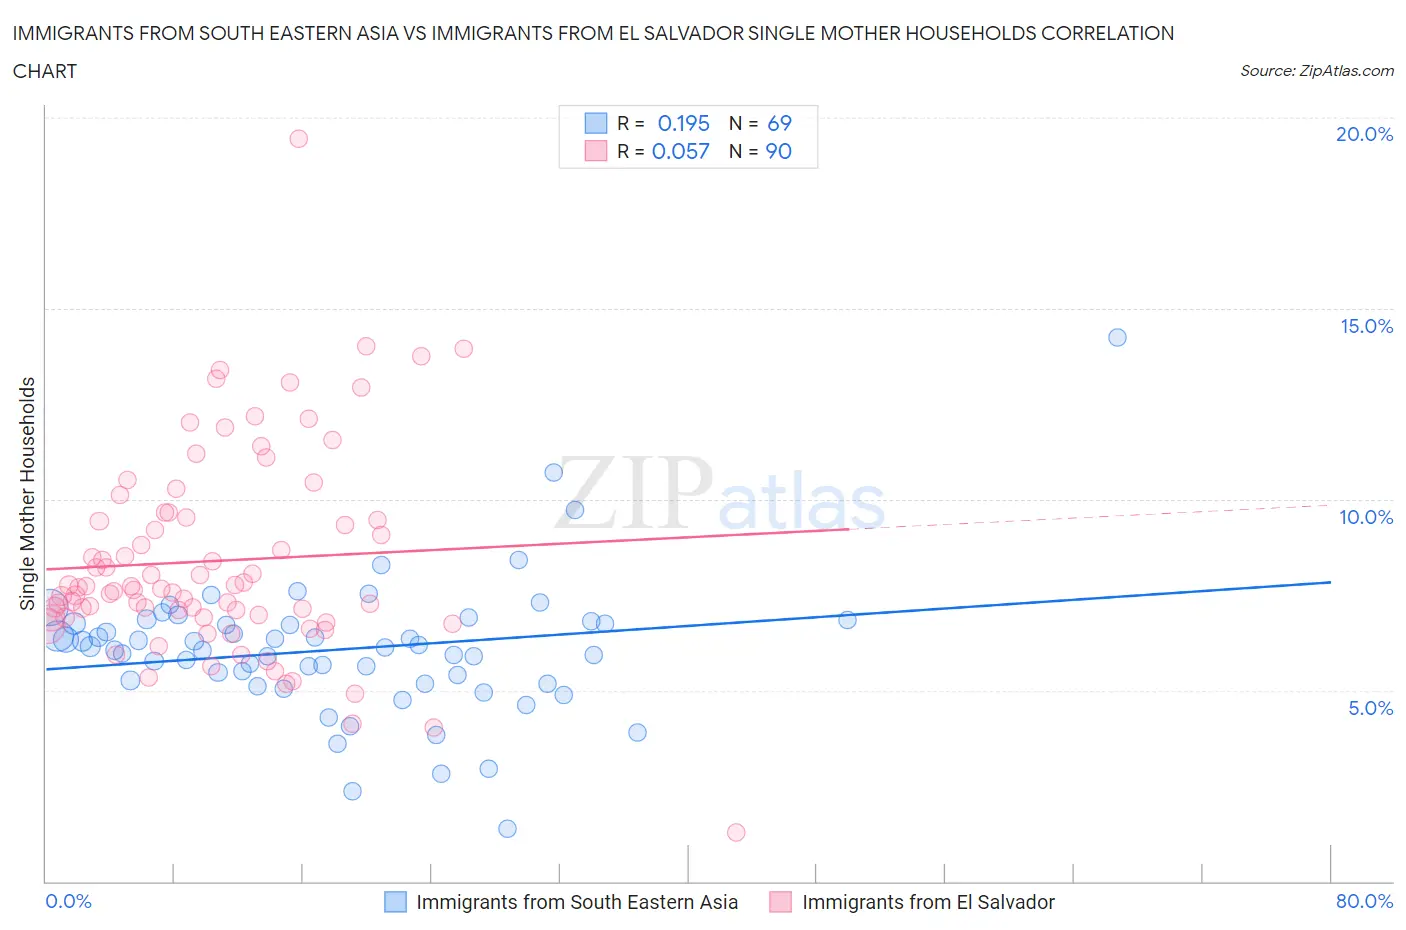
Immigrants from South Eastern Asia vs Immigrants from El Salvador Single Mother Households Correlation Chart
The statistical analysis conducted on geographies consisting of 510,269,727 people shows a poor positive correlation between the proportion of Immigrants from South Eastern Asia and percentage of single mother households in the United States with a correlation coefficient (R) of 0.195 and weighted average of 6.3%. Similarly, the statistical analysis conducted on geographies consisting of 357,280,524 people shows a slight positive correlation between the proportion of Immigrants from El Salvador and percentage of single mother households in the United States with a correlation coefficient (R) of 0.057 and weighted average of 7.6%, a difference of 21.1%.
Single Mother Households Correlation Summary
| Measurement | Immigrants from South Eastern Asia | Immigrants from El Salvador |
| Minimum | 1.4% | 1.3% |
| Maximum | 14.2% | 19.4% |
| Range | 12.9% | 18.2% |
| Mean | 6.1% | 8.4% |
| Median | 6.1% | 7.7% |
| Interquartile 25% (IQ1) | 5.2% | 6.9% |
| Interquartile 75% (IQ3) | 6.8% | 9.5% |
| Interquartile Range (IQR) | 1.6% | 2.6% |
| Standard Deviation (Sample) | 1.8% | 2.7% |
| Standard Deviation (Population) | 1.8% | 2.7% |
Similar Demographics by Single Mother Households
Demographics Similar to Immigrants from South Eastern Asia by Single Mother Households
In terms of single mother households, the demographic groups most similar to Immigrants from South Eastern Asia are Afghan (6.3%, a difference of 0.040%), Immigrants from Vietnam (6.3%, a difference of 0.070%), Immigrants from Morocco (6.3%, a difference of 0.24%), Immigrants from Oceania (6.3%, a difference of 0.26%), and Puget Sound Salish (6.3%, a difference of 0.66%).
| Demographics | Rating | Rank | Single Mother Households |
| Immigrants | Syria | 67.4 /100 | #165 | Good 6.2% |
| Sri Lankans | 63.9 /100 | #166 | Good 6.2% |
| Brazilians | 59.1 /100 | #167 | Average 6.2% |
| Immigrants | Chile | 58.3 /100 | #168 | Average 6.3% |
| Puget Sound Salish | 58.1 /100 | #169 | Average 6.3% |
| Immigrants | Oceania | 54.6 /100 | #170 | Average 6.3% |
| Afghans | 52.5 /100 | #171 | Average 6.3% |
| Immigrants | South Eastern Asia | 52.2 /100 | #172 | Average 6.3% |
| Immigrants | Vietnam | 51.5 /100 | #173 | Average 6.3% |
| Immigrants | Morocco | 50.0 /100 | #174 | Average 6.3% |
| Marshallese | 45.8 /100 | #175 | Average 6.3% |
| Immigrants | Bosnia and Herzegovina | 44.3 /100 | #176 | Average 6.3% |
| Osage | 43.0 /100 | #177 | Average 6.4% |
| Portuguese | 40.0 /100 | #178 | Fair 6.4% |
| Hmong | 39.8 /100 | #179 | Fair 6.4% |
Demographics Similar to Immigrants from El Salvador by Single Mother Households
In terms of single mother households, the demographic groups most similar to Immigrants from El Salvador are Central American (7.6%, a difference of 0.22%), Immigrants from Trinidad and Tobago (7.6%, a difference of 0.23%), Guyanese (7.6%, a difference of 0.27%), Immigrants from Sierra Leone (7.7%, a difference of 0.52%), and Immigrants from Laos (7.7%, a difference of 0.52%).
| Demographics | Rating | Rank | Single Mother Households |
| Immigrants | Azores | 0.1 /100 | #272 | Tragic 7.5% |
| Belizeans | 0.1 /100 | #273 | Tragic 7.6% |
| Immigrants | Guyana | 0.1 /100 | #274 | Tragic 7.6% |
| Central American Indians | 0.1 /100 | #275 | Tragic 7.6% |
| Guyanese | 0.1 /100 | #276 | Tragic 7.6% |
| Immigrants | Trinidad and Tobago | 0.1 /100 | #277 | Tragic 7.6% |
| Central Americans | 0.1 /100 | #278 | Tragic 7.6% |
| Immigrants | El Salvador | 0.0 /100 | #279 | Tragic 7.6% |
| Immigrants | Sierra Leone | 0.0 /100 | #280 | Tragic 7.7% |
| Immigrants | Laos | 0.0 /100 | #281 | Tragic 7.7% |
| Guatemalans | 0.0 /100 | #282 | Tragic 7.7% |
| Nigerians | 0.0 /100 | #283 | Tragic 7.7% |
| Immigrants | Belize | 0.0 /100 | #284 | Tragic 7.7% |
| Trinidadians and Tobagonians | 0.0 /100 | #285 | Tragic 7.7% |
| Immigrants | Middle Africa | 0.0 /100 | #286 | Tragic 7.7% |