Immigrants from South America vs Liberian Family Households with Children
COMPARE
Immigrants from South America
Liberian
Family Households with Children
Family Households with Children Comparison
Immigrants from South America
Liberians
28.0%
FAMILY HOUSEHOLDS WITH CHILDREN
98.0/ 100
METRIC RATING
106th/ 347
METRIC RANK
28.3%
FAMILY HOUSEHOLDS WITH CHILDREN
99.6/ 100
METRIC RATING
88th/ 347
METRIC RANK
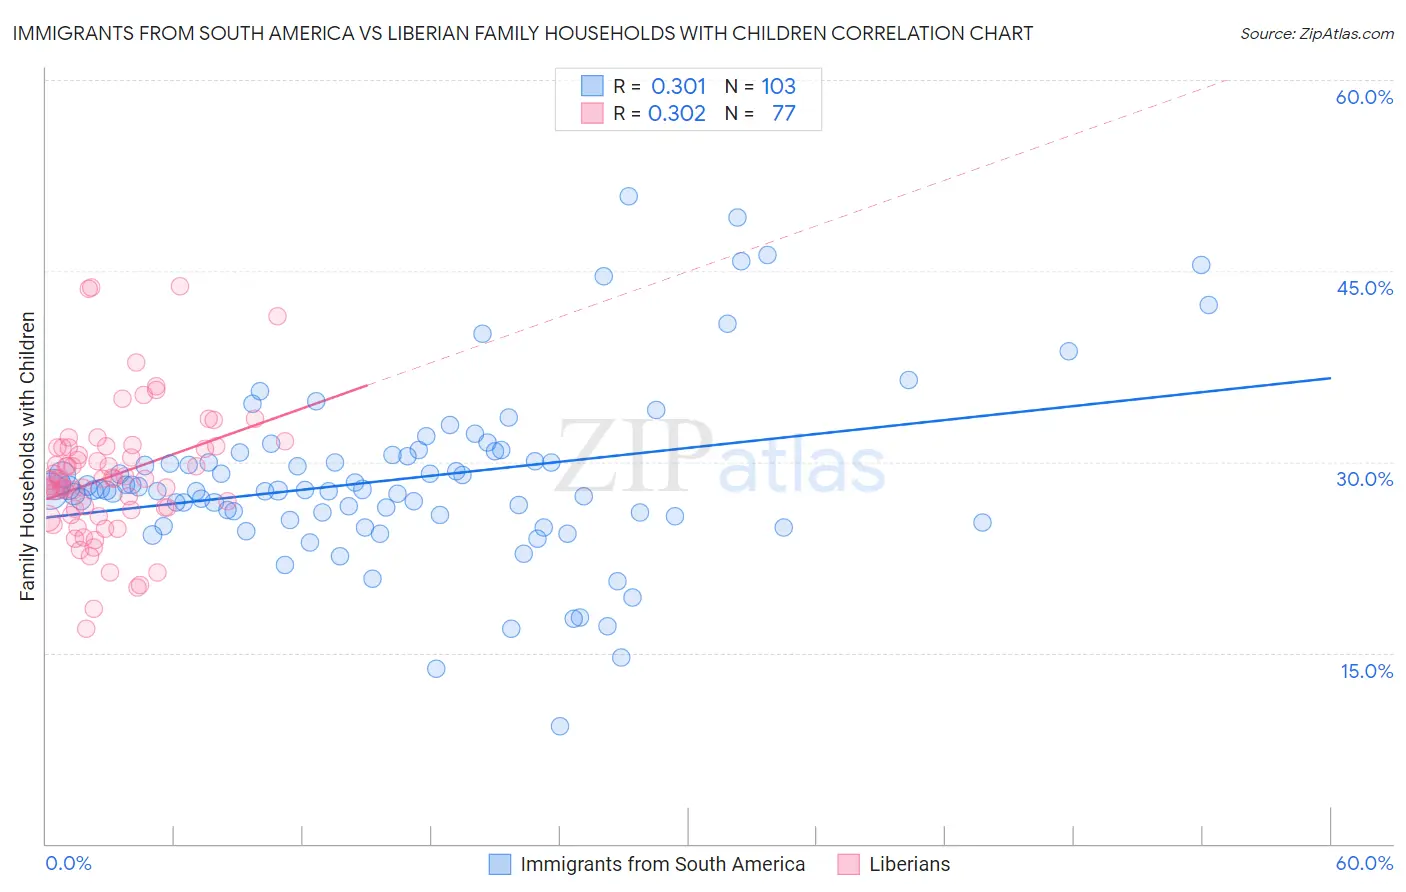
Immigrants from South America vs Liberian Family Households with Children Correlation Chart
The statistical analysis conducted on geographies consisting of 485,768,775 people shows a mild positive correlation between the proportion of Immigrants from South America and percentage of family households with children in the United States with a correlation coefficient (R) of 0.301 and weighted average of 28.0%. Similarly, the statistical analysis conducted on geographies consisting of 118,011,319 people shows a mild positive correlation between the proportion of Liberians and percentage of family households with children in the United States with a correlation coefficient (R) of 0.302 and weighted average of 28.3%, a difference of 0.86%.
Family Households with Children Correlation Summary
| Measurement | Immigrants from South America | Liberian |
| Minimum | 9.2% | 16.9% |
| Maximum | 50.9% | 43.8% |
| Range | 41.7% | 27.0% |
| Mean | 28.6% | 28.9% |
| Median | 27.8% | 28.7% |
| Interquartile 25% (IQ1) | 25.8% | 26.0% |
| Interquartile 75% (IQ3) | 30.5% | 31.2% |
| Interquartile Range (IQR) | 4.8% | 5.1% |
| Standard Deviation (Sample) | 6.9% | 5.2% |
| Standard Deviation (Population) | 6.9% | 5.2% |
Demographics Similar to Immigrants from South America and Liberians by Family Households with Children
In terms of family households with children, the demographic groups most similar to Immigrants from South America are Immigrants from Uganda (28.0%, a difference of 0.060%), Choctaw (28.1%, a difference of 0.10%), Sioux (28.1%, a difference of 0.11%), Palestinian (28.1%, a difference of 0.15%), and Assyrian/Chaldean/Syriac (28.1%, a difference of 0.26%). Similarly, the demographic groups most similar to Liberians are Colombian (28.3%, a difference of 0.010%), Immigrants from Costa Rica (28.3%, a difference of 0.010%), Immigrants from Thailand (28.2%, a difference of 0.11%), Immigrants from Liberia (28.2%, a difference of 0.16%), and Chickasaw (28.2%, a difference of 0.19%).
| Demographics | Rating | Rank | Family Households with Children |
| Colombians | 99.6 /100 | #87 | Exceptional 28.3% |
| Liberians | 99.6 /100 | #88 | Exceptional 28.3% |
| Immigrants | Costa Rica | 99.6 /100 | #89 | Exceptional 28.3% |
| Immigrants | Thailand | 99.5 /100 | #90 | Exceptional 28.2% |
| Immigrants | Liberia | 99.4 /100 | #91 | Exceptional 28.2% |
| Chickasaw | 99.4 /100 | #92 | Exceptional 28.2% |
| Panamanians | 99.3 /100 | #93 | Exceptional 28.2% |
| Immigrants | Colombia | 99.2 /100 | #94 | Exceptional 28.2% |
| Immigrants | Nicaragua | 99.1 /100 | #95 | Exceptional 28.2% |
| Ute | 99.1 /100 | #96 | Exceptional 28.2% |
| Chileans | 98.9 /100 | #97 | Exceptional 28.1% |
| Immigrants | Kenya | 98.9 /100 | #98 | Exceptional 28.1% |
| Immigrants | Azores | 98.8 /100 | #99 | Exceptional 28.1% |
| Indonesians | 98.8 /100 | #100 | Exceptional 28.1% |
| Immigrants | Oceania | 98.8 /100 | #101 | Exceptional 28.1% |
| Assyrians/Chaldeans/Syriacs | 98.7 /100 | #102 | Exceptional 28.1% |
| Palestinians | 98.5 /100 | #103 | Exceptional 28.1% |
| Sioux | 98.3 /100 | #104 | Exceptional 28.1% |
| Choctaw | 98.3 /100 | #105 | Exceptional 28.1% |
| Immigrants | South America | 98.0 /100 | #106 | Exceptional 28.0% |
| Immigrants | Uganda | 97.7 /100 | #107 | Exceptional 28.0% |