Immigrants from South America vs Chilean Family Households with Children
COMPARE
Immigrants from South America
Chilean
Family Households with Children
Family Households with Children Comparison
Immigrants from South America
Chileans
28.0%
FAMILY HOUSEHOLDS WITH CHILDREN
98.0/ 100
METRIC RATING
106th/ 347
METRIC RANK
28.1%
FAMILY HOUSEHOLDS WITH CHILDREN
98.9/ 100
METRIC RATING
97th/ 347
METRIC RANK
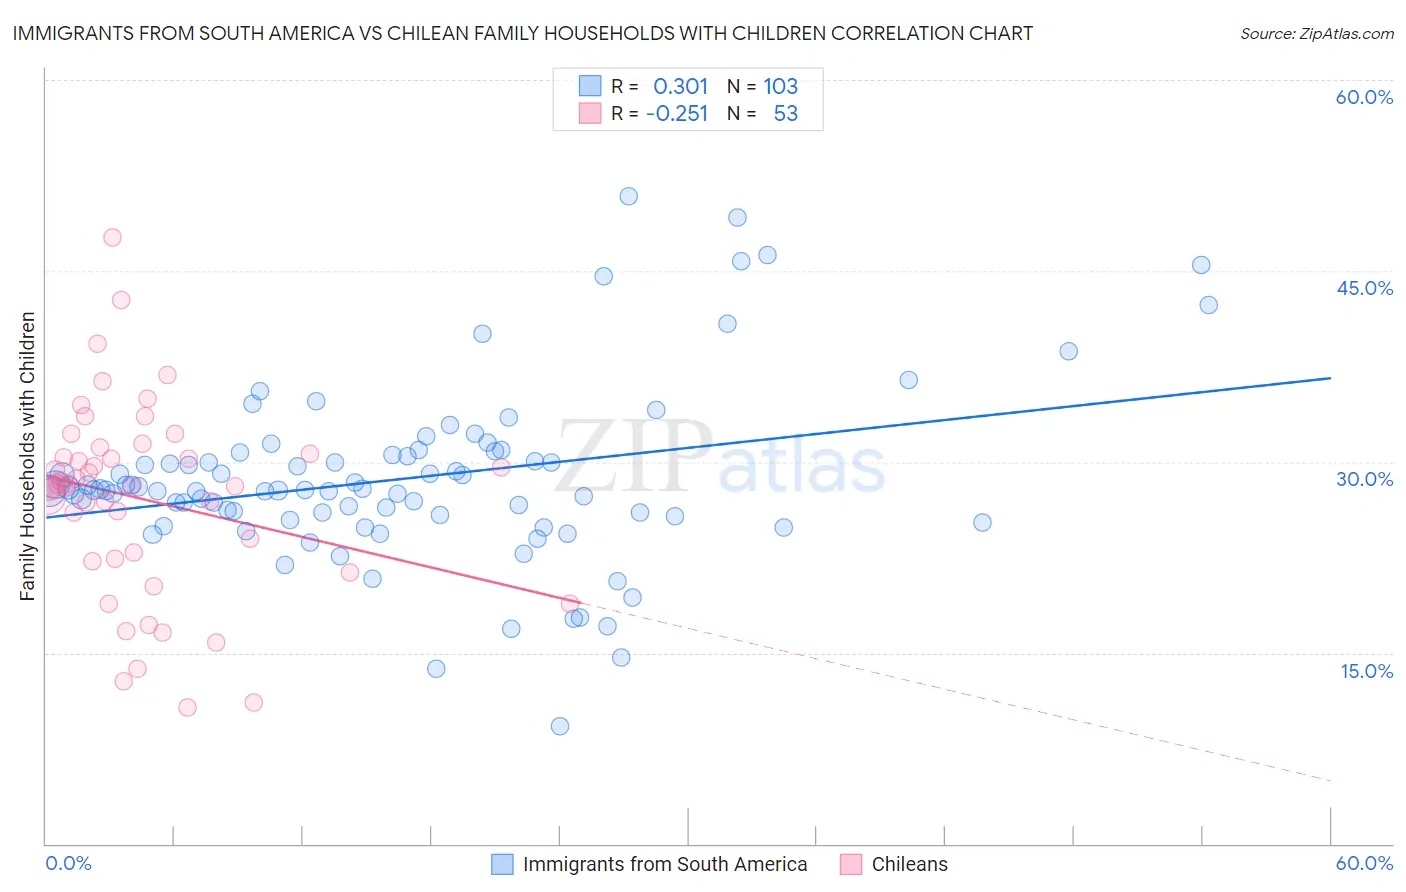
Immigrants from South America vs Chilean Family Households with Children Correlation Chart
The statistical analysis conducted on geographies consisting of 485,768,775 people shows a mild positive correlation between the proportion of Immigrants from South America and percentage of family households with children in the United States with a correlation coefficient (R) of 0.301 and weighted average of 28.0%. Similarly, the statistical analysis conducted on geographies consisting of 256,524,763 people shows a weak negative correlation between the proportion of Chileans and percentage of family households with children in the United States with a correlation coefficient (R) of -0.251 and weighted average of 28.1%, a difference of 0.36%.
Family Households with Children Correlation Summary
| Measurement | Immigrants from South America | Chilean |
| Minimum | 9.2% | 10.7% |
| Maximum | 50.9% | 47.6% |
| Range | 41.7% | 36.9% |
| Mean | 28.6% | 27.1% |
| Median | 27.8% | 28.1% |
| Interquartile 25% (IQ1) | 25.8% | 22.3% |
| Interquartile 75% (IQ3) | 30.5% | 30.9% |
| Interquartile Range (IQR) | 4.8% | 8.6% |
| Standard Deviation (Sample) | 6.9% | 7.6% |
| Standard Deviation (Population) | 6.9% | 7.5% |
Demographics Similar to Immigrants from South America and Chileans by Family Households with Children
In terms of family households with children, the demographic groups most similar to Immigrants from South America are Immigrants from Uganda (28.0%, a difference of 0.060%), Immigrants from Burma/Myanmar (28.0%, a difference of 0.080%), Tohono O'odham (28.0%, a difference of 0.090%), Choctaw (28.1%, a difference of 0.10%), and Sioux (28.1%, a difference of 0.11%). Similarly, the demographic groups most similar to Chileans are Immigrants from Kenya (28.1%, a difference of 0.040%), Immigrants from the Azores (28.1%, a difference of 0.050%), Ute (28.2%, a difference of 0.060%), Indonesian (28.1%, a difference of 0.060%), and Immigrants from Nicaragua (28.2%, a difference of 0.080%).
| Demographics | Rating | Rank | Family Households with Children |
| Immigrants | Liberia | 99.4 /100 | #91 | Exceptional 28.2% |
| Chickasaw | 99.4 /100 | #92 | Exceptional 28.2% |
| Panamanians | 99.3 /100 | #93 | Exceptional 28.2% |
| Immigrants | Colombia | 99.2 /100 | #94 | Exceptional 28.2% |
| Immigrants | Nicaragua | 99.1 /100 | #95 | Exceptional 28.2% |
| Ute | 99.1 /100 | #96 | Exceptional 28.2% |
| Chileans | 98.9 /100 | #97 | Exceptional 28.1% |
| Immigrants | Kenya | 98.9 /100 | #98 | Exceptional 28.1% |
| Immigrants | Azores | 98.8 /100 | #99 | Exceptional 28.1% |
| Indonesians | 98.8 /100 | #100 | Exceptional 28.1% |
| Immigrants | Oceania | 98.8 /100 | #101 | Exceptional 28.1% |
| Assyrians/Chaldeans/Syriacs | 98.7 /100 | #102 | Exceptional 28.1% |
| Palestinians | 98.5 /100 | #103 | Exceptional 28.1% |
| Sioux | 98.3 /100 | #104 | Exceptional 28.1% |
| Choctaw | 98.3 /100 | #105 | Exceptional 28.1% |
| Immigrants | South America | 98.0 /100 | #106 | Exceptional 28.0% |
| Immigrants | Uganda | 97.7 /100 | #107 | Exceptional 28.0% |
| Immigrants | Burma/Myanmar | 97.7 /100 | #108 | Exceptional 28.0% |
| Tohono O'odham | 97.6 /100 | #109 | Exceptional 28.0% |
| Spaniards | 97.4 /100 | #110 | Exceptional 28.0% |
| Scandinavians | 97.1 /100 | #111 | Exceptional 28.0% |