Immigrants from Ireland vs Liberian Family Households with Children
COMPARE
Immigrants from Ireland
Liberian
Family Households with Children
Family Households with Children Comparison
Immigrants from Ireland
Liberians
26.0%
FAMILY HOUSEHOLDS WITH CHILDREN
0.0/ 100
METRIC RATING
326th/ 347
METRIC RANK
28.3%
FAMILY HOUSEHOLDS WITH CHILDREN
99.6/ 100
METRIC RATING
88th/ 347
METRIC RANK
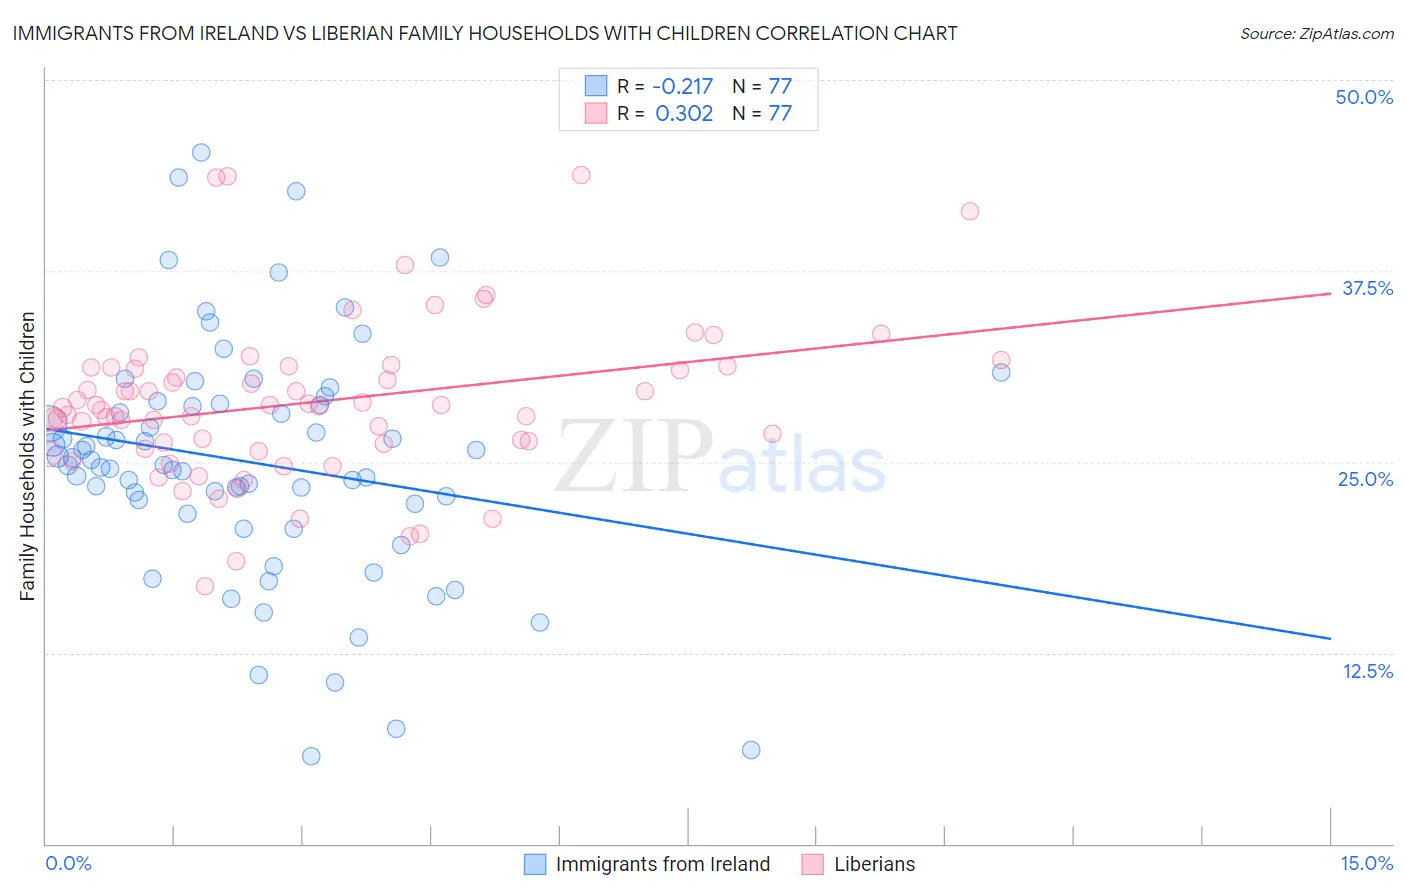
Immigrants from Ireland vs Liberian Family Households with Children Correlation Chart
The statistical analysis conducted on geographies consisting of 240,683,763 people shows a weak negative correlation between the proportion of Immigrants from Ireland and percentage of family households with children in the United States with a correlation coefficient (R) of -0.217 and weighted average of 26.0%. Similarly, the statistical analysis conducted on geographies consisting of 118,011,319 people shows a mild positive correlation between the proportion of Liberians and percentage of family households with children in the United States with a correlation coefficient (R) of 0.302 and weighted average of 28.3%, a difference of 8.8%.
Family Households with Children Correlation Summary
| Measurement | Immigrants from Ireland | Liberian |
| Minimum | 5.7% | 16.9% |
| Maximum | 45.3% | 43.8% |
| Range | 39.6% | 27.0% |
| Mean | 25.0% | 28.9% |
| Median | 24.8% | 28.7% |
| Interquartile 25% (IQ1) | 21.9% | 26.0% |
| Interquartile 75% (IQ3) | 28.8% | 31.2% |
| Interquartile Range (IQR) | 6.9% | 5.1% |
| Standard Deviation (Sample) | 7.8% | 5.2% |
| Standard Deviation (Population) | 7.7% | 5.2% |
Similar Demographics by Family Households with Children
Demographics Similar to Immigrants from Ireland by Family Households with Children
In terms of family households with children, the demographic groups most similar to Immigrants from Ireland are Barbadian (26.0%, a difference of 0.030%), Chinese (26.0%, a difference of 0.080%), Immigrants from Barbados (26.0%, a difference of 0.11%), Immigrants from Australia (26.0%, a difference of 0.12%), and Immigrants from Greece (26.0%, a difference of 0.15%).
| Demographics | Rating | Rank | Family Households with Children |
| Immigrants | France | 0.0 /100 | #319 | Tragic 26.0% |
| Tlingit-Haida | 0.0 /100 | #320 | Tragic 26.0% |
| British West Indians | 0.0 /100 | #321 | Tragic 26.0% |
| Immigrants | Greece | 0.0 /100 | #322 | Tragic 26.0% |
| Immigrants | Australia | 0.0 /100 | #323 | Tragic 26.0% |
| Chinese | 0.0 /100 | #324 | Tragic 26.0% |
| Barbadians | 0.0 /100 | #325 | Tragic 26.0% |
| Immigrants | Ireland | 0.0 /100 | #326 | Tragic 26.0% |
| Immigrants | Barbados | 0.0 /100 | #327 | Tragic 26.0% |
| Immigrants | Albania | 0.0 /100 | #328 | Tragic 25.9% |
| Cypriots | 0.0 /100 | #329 | Tragic 25.9% |
| Immigrants | Latvia | 0.0 /100 | #330 | Tragic 25.9% |
| Slovenes | 0.0 /100 | #331 | Tragic 25.8% |
| Immigrants | Austria | 0.0 /100 | #332 | Tragic 25.8% |
| Immigrants | Switzerland | 0.0 /100 | #333 | Tragic 25.7% |
Demographics Similar to Liberians by Family Households with Children
In terms of family households with children, the demographic groups most similar to Liberians are Colombian (28.3%, a difference of 0.010%), Immigrants from Costa Rica (28.3%, a difference of 0.010%), Immigrants from Western Africa (28.3%, a difference of 0.070%), Immigrants from Thailand (28.2%, a difference of 0.11%), and Immigrants from Liberia (28.2%, a difference of 0.16%).
| Demographics | Rating | Rank | Family Households with Children |
| South Americans | 99.8 /100 | #81 | Exceptional 28.4% |
| Kenyans | 99.8 /100 | #82 | Exceptional 28.4% |
| Nicaraguans | 99.8 /100 | #83 | Exceptional 28.4% |
| Costa Ricans | 99.8 /100 | #84 | Exceptional 28.4% |
| Immigrants | Syria | 99.8 /100 | #85 | Exceptional 28.4% |
| Immigrants | Western Africa | 99.6 /100 | #86 | Exceptional 28.3% |
| Colombians | 99.6 /100 | #87 | Exceptional 28.3% |
| Liberians | 99.6 /100 | #88 | Exceptional 28.3% |
| Immigrants | Costa Rica | 99.6 /100 | #89 | Exceptional 28.3% |
| Immigrants | Thailand | 99.5 /100 | #90 | Exceptional 28.2% |
| Immigrants | Liberia | 99.4 /100 | #91 | Exceptional 28.2% |
| Chickasaw | 99.4 /100 | #92 | Exceptional 28.2% |
| Panamanians | 99.3 /100 | #93 | Exceptional 28.2% |
| Immigrants | Colombia | 99.2 /100 | #94 | Exceptional 28.2% |
| Immigrants | Nicaragua | 99.1 /100 | #95 | Exceptional 28.2% |