Immigrants from South Eastern Asia vs Polish Births to Unmarried Women
COMPARE
Immigrants from South Eastern Asia
Polish
Births to Unmarried Women
Births to Unmarried Women Comparison
Immigrants from South Eastern Asia
Poles
30.4%
BIRTHS TO UNMARRIED WOMEN
85.2/ 100
METRIC RATING
134th/ 347
METRIC RANK
30.8%
BIRTHS TO UNMARRIED WOMEN
76.2/ 100
METRIC RATING
152nd/ 347
METRIC RANK
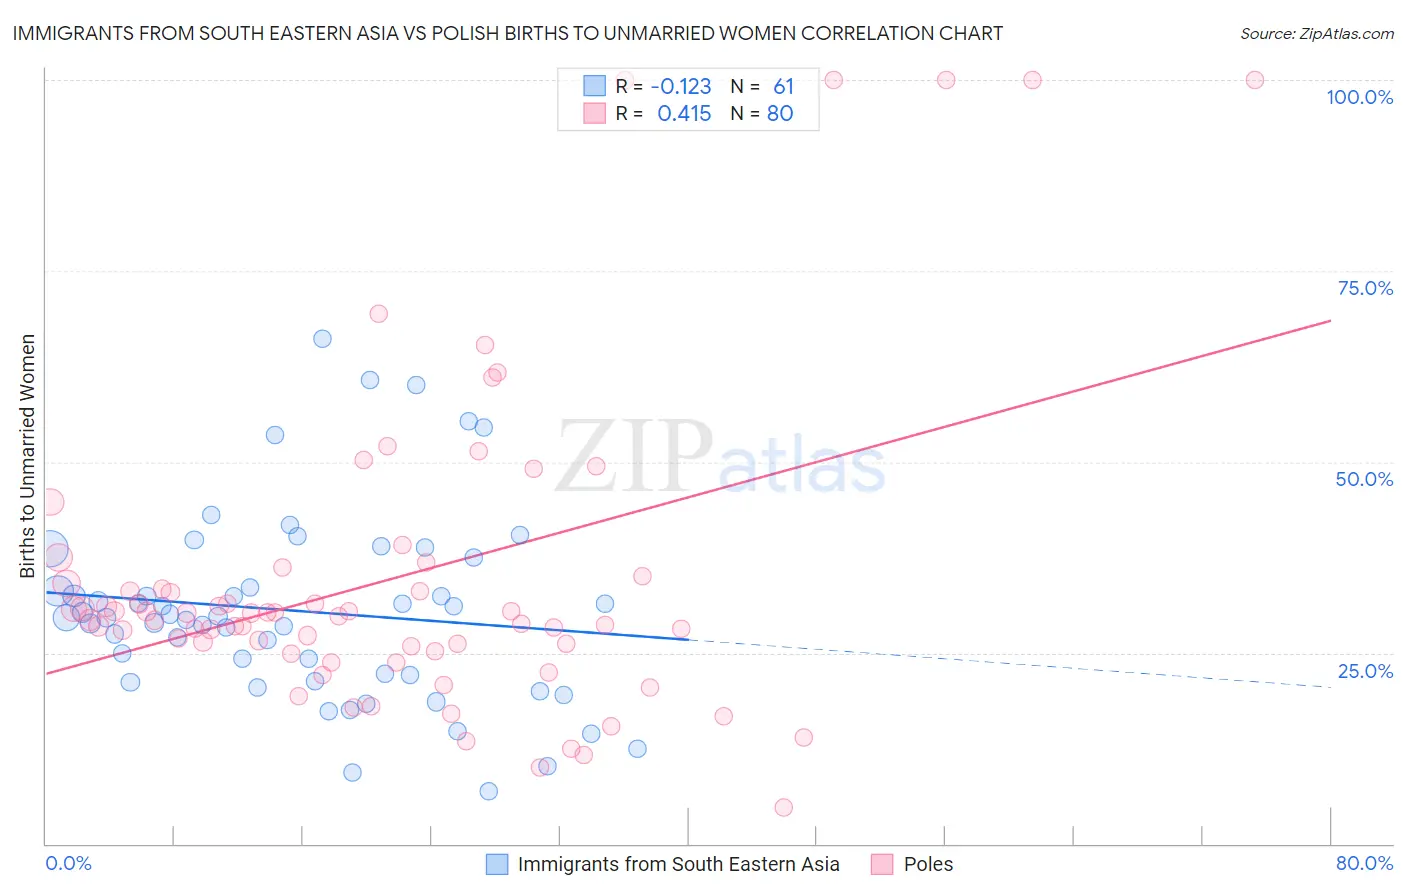
Immigrants from South Eastern Asia vs Polish Births to Unmarried Women Correlation Chart
The statistical analysis conducted on geographies consisting of 468,318,705 people shows a poor negative correlation between the proportion of Immigrants from South Eastern Asia and percentage of births to unmarried women in the United States with a correlation coefficient (R) of -0.123 and weighted average of 30.4%. Similarly, the statistical analysis conducted on geographies consisting of 497,645,952 people shows a moderate positive correlation between the proportion of Poles and percentage of births to unmarried women in the United States with a correlation coefficient (R) of 0.415 and weighted average of 30.8%, a difference of 1.5%.
Births to Unmarried Women Correlation Summary
| Measurement | Immigrants from South Eastern Asia | Polish |
| Minimum | 6.9% | 4.8% |
| Maximum | 66.2% | 100.0% |
| Range | 59.3% | 95.2% |
| Mean | 30.4% | 34.7% |
| Median | 29.7% | 30.0% |
| Interquartile 25% (IQ1) | 21.7% | 25.6% |
| Interquartile 75% (IQ3) | 35.4% | 34.5% |
| Interquartile Range (IQR) | 13.7% | 9.0% |
| Standard Deviation (Sample) | 12.5% | 20.7% |
| Standard Deviation (Population) | 12.4% | 20.6% |
Demographics Similar to Immigrants from South Eastern Asia and Poles by Births to Unmarried Women
In terms of births to unmarried women, the demographic groups most similar to Immigrants from South Eastern Asia are Immigrants from Morocco (30.4%, a difference of 0.010%), Brazilian (30.4%, a difference of 0.070%), Immigrants from Scotland (30.4%, a difference of 0.11%), Immigrants from Philippines (30.4%, a difference of 0.24%), and Puget Sound Salish (30.4%, a difference of 0.24%). Similarly, the demographic groups most similar to Poles are British (30.8%, a difference of 0.020%), Italian (30.8%, a difference of 0.11%), Somali (30.7%, a difference of 0.22%), Serbian (30.7%, a difference of 0.36%), and Chilean (30.7%, a difference of 0.41%).
| Demographics | Rating | Rank | Births to Unmarried Women |
| Immigrants | Morocco | 85.2 /100 | #133 | Excellent 30.4% |
| Immigrants | South Eastern Asia | 85.2 /100 | #134 | Excellent 30.4% |
| Brazilians | 84.8 /100 | #135 | Excellent 30.4% |
| Immigrants | Scotland | 84.6 /100 | #136 | Excellent 30.4% |
| Immigrants | Philippines | 83.9 /100 | #137 | Excellent 30.4% |
| Puget Sound Salish | 83.9 /100 | #138 | Excellent 30.4% |
| Immigrants | Canada | 83.7 /100 | #139 | Excellent 30.4% |
| Swiss | 83.1 /100 | #140 | Excellent 30.5% |
| Pakistanis | 83.0 /100 | #141 | Excellent 30.5% |
| South Africans | 82.7 /100 | #142 | Excellent 30.5% |
| Immigrants | Uganda | 82.6 /100 | #143 | Excellent 30.5% |
| Czechs | 82.1 /100 | #144 | Excellent 30.5% |
| Immigrants | North America | 81.5 /100 | #145 | Excellent 30.6% |
| Northern Europeans | 81.4 /100 | #146 | Excellent 30.6% |
| Immigrants | Oceania | 81.2 /100 | #147 | Excellent 30.6% |
| Chileans | 79.1 /100 | #148 | Good 30.7% |
| Serbians | 78.8 /100 | #149 | Good 30.7% |
| Somalis | 77.8 /100 | #150 | Good 30.7% |
| Italians | 77.0 /100 | #151 | Good 30.8% |
| Poles | 76.2 /100 | #152 | Good 30.8% |
| British | 76.0 /100 | #153 | Good 30.8% |