Immigrants from South Africa vs Immigrants from Philippines Single Father Households
COMPARE
Immigrants from South Africa
Immigrants from Philippines
Single Father Households
Single Father Households Comparison
Immigrants from South Africa
Immigrants from Philippines
2.1%
SINGLE FATHER HOUSEHOLDS
99.7/ 100
METRIC RATING
80th/ 347
METRIC RANK
2.4%
SINGLE FATHER HOUSEHOLDS
28.7/ 100
METRIC RATING
195th/ 347
METRIC RANK
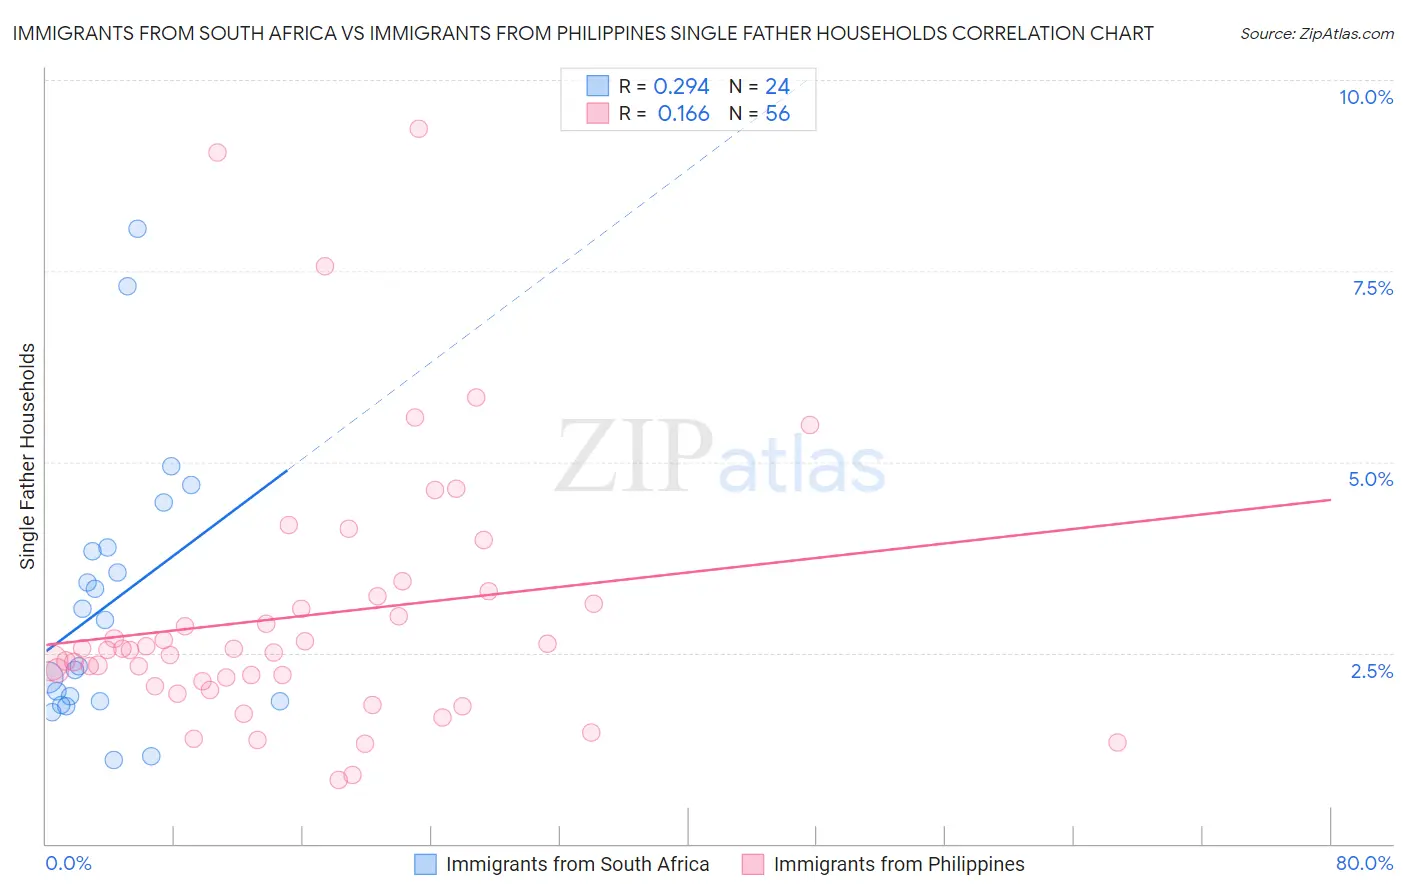
Immigrants from South Africa vs Immigrants from Philippines Single Father Households Correlation Chart
The statistical analysis conducted on geographies consisting of 231,943,382 people shows a weak positive correlation between the proportion of Immigrants from South Africa and percentage of single father households in the United States with a correlation coefficient (R) of 0.294 and weighted average of 2.1%. Similarly, the statistical analysis conducted on geographies consisting of 466,021,728 people shows a poor positive correlation between the proportion of Immigrants from Philippines and percentage of single father households in the United States with a correlation coefficient (R) of 0.166 and weighted average of 2.4%, a difference of 13.8%.
Single Father Households Correlation Summary
| Measurement | Immigrants from South Africa | Immigrants from Philippines |
| Minimum | 1.1% | 0.84% |
| Maximum | 8.1% | 9.4% |
| Range | 7.0% | 8.5% |
| Mean | 3.1% | 3.0% |
| Median | 2.6% | 2.5% |
| Interquartile 25% (IQ1) | 1.9% | 2.1% |
| Interquartile 75% (IQ3) | 3.8% | 3.2% |
| Interquartile Range (IQR) | 2.0% | 1.1% |
| Standard Deviation (Sample) | 1.8% | 1.7% |
| Standard Deviation (Population) | 1.7% | 1.7% |
Similar Demographics by Single Father Households
Demographics Similar to Immigrants from South Africa by Single Father Households
In terms of single father households, the demographic groups most similar to Immigrants from South Africa are Armenian (2.1%, a difference of 0.080%), Immigrants from Asia (2.1%, a difference of 0.090%), New Zealander (2.1%, a difference of 0.13%), Greek (2.1%, a difference of 0.14%), and Estonian (2.1%, a difference of 0.20%).
| Demographics | Rating | Rank | Single Father Households |
| Immigrants | Bangladesh | 99.8 /100 | #73 | Exceptional 2.1% |
| Immigrants | Egypt | 99.8 /100 | #74 | Exceptional 2.1% |
| Immigrants | Sweden | 99.8 /100 | #75 | Exceptional 2.1% |
| Immigrants | Scotland | 99.8 /100 | #76 | Exceptional 2.1% |
| Immigrants | Saudi Arabia | 99.8 /100 | #77 | Exceptional 2.1% |
| Estonians | 99.7 /100 | #78 | Exceptional 2.1% |
| Immigrants | Asia | 99.7 /100 | #79 | Exceptional 2.1% |
| Immigrants | South Africa | 99.7 /100 | #80 | Exceptional 2.1% |
| Armenians | 99.7 /100 | #81 | Exceptional 2.1% |
| New Zealanders | 99.7 /100 | #82 | Exceptional 2.1% |
| Greeks | 99.7 /100 | #83 | Exceptional 2.1% |
| Carpatho Rusyns | 99.6 /100 | #84 | Exceptional 2.1% |
| Immigrants | Hungary | 99.6 /100 | #85 | Exceptional 2.1% |
| Asians | 99.6 /100 | #86 | Exceptional 2.1% |
| Lithuanians | 99.5 /100 | #87 | Exceptional 2.1% |
Demographics Similar to Immigrants from Philippines by Single Father Households
In terms of single father households, the demographic groups most similar to Immigrants from Philippines are Kenyan (2.4%, a difference of 0.060%), German (2.4%, a difference of 0.060%), Panamanian (2.4%, a difference of 0.080%), Uruguayan (2.4%, a difference of 0.090%), and Immigrants from Sudan (2.4%, a difference of 0.10%).
| Demographics | Rating | Rank | Single Father Households |
| Hmong | 33.0 /100 | #188 | Fair 2.4% |
| U.S. Virgin Islanders | 31.8 /100 | #189 | Fair 2.4% |
| French | 31.7 /100 | #190 | Fair 2.4% |
| Immigrants | Africa | 30.0 /100 | #191 | Fair 2.4% |
| Immigrants | Sudan | 29.8 /100 | #192 | Fair 2.4% |
| Uruguayans | 29.7 /100 | #193 | Fair 2.4% |
| Panamanians | 29.6 /100 | #194 | Fair 2.4% |
| Immigrants | Philippines | 28.7 /100 | #195 | Fair 2.4% |
| Kenyans | 28.0 /100 | #196 | Fair 2.4% |
| Germans | 28.0 /100 | #197 | Fair 2.4% |
| Scandinavians | 27.4 /100 | #198 | Fair 2.4% |
| Immigrants | Vietnam | 27.1 /100 | #199 | Fair 2.4% |
| Peruvians | 27.1 /100 | #200 | Fair 2.4% |
| Immigrants | Uganda | 26.0 /100 | #201 | Fair 2.4% |
| German Russians | 25.7 /100 | #202 | Fair 2.4% |