Immigrants from Singapore vs South American Births to Unmarried Women
COMPARE
Immigrants from Singapore
South American
Births to Unmarried Women
Births to Unmarried Women Comparison
Immigrants from Singapore
South Americans
25.6%
BIRTHS TO UNMARRIED WOMEN
100.0/ 100
METRIC RATING
15th/ 347
METRIC RANK
31.8%
BIRTHS TO UNMARRIED WOMEN
46.9/ 100
METRIC RATING
179th/ 347
METRIC RANK
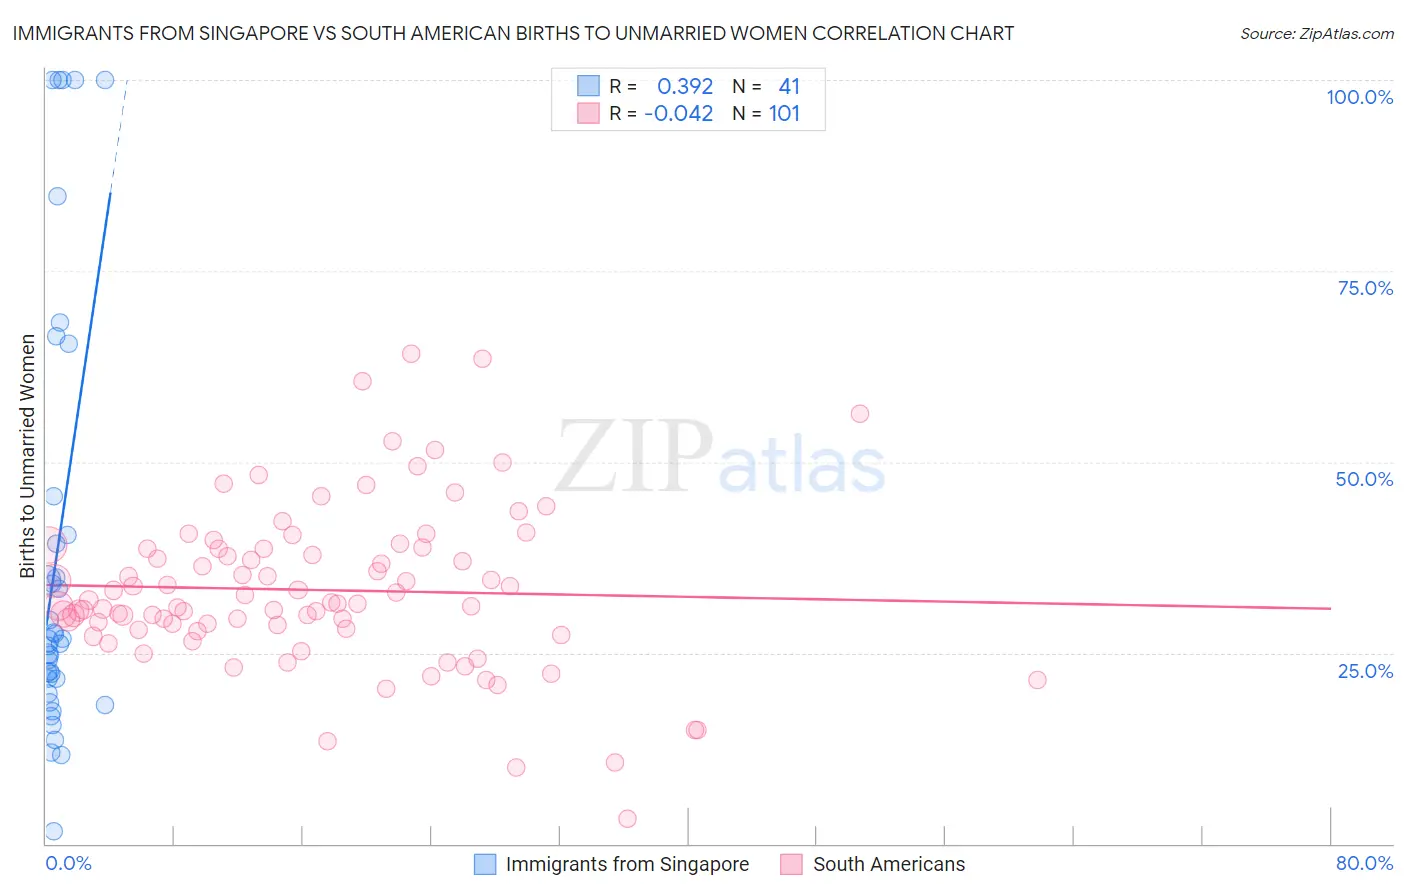
Immigrants from Singapore vs South American Births to Unmarried Women Correlation Chart
The statistical analysis conducted on geographies consisting of 131,320,191 people shows a mild positive correlation between the proportion of Immigrants from Singapore and percentage of births to unmarried women in the United States with a correlation coefficient (R) of 0.392 and weighted average of 25.6%. Similarly, the statistical analysis conducted on geographies consisting of 453,273,993 people shows no correlation between the proportion of South Americans and percentage of births to unmarried women in the United States with a correlation coefficient (R) of -0.042 and weighted average of 31.8%, a difference of 23.9%.
Births to Unmarried Women Correlation Summary
| Measurement | Immigrants from Singapore | South American |
| Minimum | 1.7% | 3.3% |
| Maximum | 100.0% | 64.1% |
| Range | 98.3% | 60.8% |
| Mean | 38.2% | 33.2% |
| Median | 26.5% | 31.4% |
| Interquartile 25% (IQ1) | 20.6% | 28.1% |
| Interquartile 75% (IQ3) | 43.0% | 38.7% |
| Interquartile Range (IQR) | 22.4% | 10.6% |
| Standard Deviation (Sample) | 28.5% | 10.6% |
| Standard Deviation (Population) | 28.1% | 10.5% |
Similar Demographics by Births to Unmarried Women
Demographics Similar to Immigrants from Singapore by Births to Unmarried Women
In terms of births to unmarried women, the demographic groups most similar to Immigrants from Singapore are Immigrants from Belarus (25.6%, a difference of 0.050%), Immigrants from Uzbekistan (25.8%, a difference of 0.62%), Immigrants from Lebanon (25.3%, a difference of 1.2%), Iranian (25.3%, a difference of 1.3%), and Indian (Asian) (25.3%, a difference of 1.4%).
| Demographics | Rating | Rank | Births to Unmarried Women |
| Immigrants | China | 100.0 /100 | #8 | Exceptional 24.7% |
| Immigrants | South Central Asia | 100.0 /100 | #9 | Exceptional 24.7% |
| Immigrants | Eastern Asia | 100.0 /100 | #10 | Exceptional 25.0% |
| Immigrants | Israel | 100.0 /100 | #11 | Exceptional 25.1% |
| Indians (Asian) | 100.0 /100 | #12 | Exceptional 25.3% |
| Iranians | 100.0 /100 | #13 | Exceptional 25.3% |
| Immigrants | Lebanon | 100.0 /100 | #14 | Exceptional 25.3% |
| Immigrants | Singapore | 100.0 /100 | #15 | Exceptional 25.6% |
| Immigrants | Belarus | 100.0 /100 | #16 | Exceptional 25.6% |
| Immigrants | Uzbekistan | 100.0 /100 | #17 | Exceptional 25.8% |
| Immigrants | Armenia | 99.9 /100 | #18 | Exceptional 26.1% |
| Armenians | 99.9 /100 | #19 | Exceptional 26.2% |
| Immigrants | Korea | 99.9 /100 | #20 | Exceptional 26.3% |
| Soviet Union | 99.9 /100 | #21 | Exceptional 26.3% |
| Burmese | 99.9 /100 | #22 | Exceptional 26.4% |
Demographics Similar to South Americans by Births to Unmarried Women
In terms of births to unmarried women, the demographic groups most similar to South Americans are English (31.7%, a difference of 0.040%), South American Indian (31.7%, a difference of 0.070%), Scottish (31.7%, a difference of 0.11%), Moroccan (31.8%, a difference of 0.11%), and Immigrants from Peru (31.8%, a difference of 0.18%).
| Demographics | Rating | Rank | Births to Unmarried Women |
| Immigrants | Eritrea | 50.4 /100 | #172 | Average 31.7% |
| Immigrants | Yemen | 50.2 /100 | #173 | Average 31.7% |
| Venezuelans | 50.0 /100 | #174 | Average 31.7% |
| Immigrants | Venezuela | 49.2 /100 | #175 | Average 31.7% |
| Scottish | 48.1 /100 | #176 | Average 31.7% |
| South American Indians | 47.7 /100 | #177 | Average 31.7% |
| English | 47.4 /100 | #178 | Average 31.7% |
| South Americans | 46.9 /100 | #179 | Average 31.8% |
| Moroccans | 45.7 /100 | #180 | Average 31.8% |
| Immigrants | Peru | 45.1 /100 | #181 | Average 31.8% |
| Kenyans | 43.0 /100 | #182 | Average 31.9% |
| Canadians | 41.4 /100 | #183 | Average 31.9% |
| Immigrants | South America | 40.7 /100 | #184 | Average 32.0% |
| Germans | 39.5 /100 | #185 | Fair 32.0% |
| Welsh | 38.2 /100 | #186 | Fair 32.0% |