Yup'ik vs Japanese Divorced or Separated
COMPARE
Yup'ik
Japanese
Divorced or Separated
Divorced or Separated Comparison
Yup'ik
Japanese
10.3%
DIVORCED OR SEPARATED
100.0/ 100
METRIC RATING
9th/ 347
METRIC RANK
12.0%
DIVORCED OR SEPARATED
70.9/ 100
METRIC RATING
155th/ 347
METRIC RANK
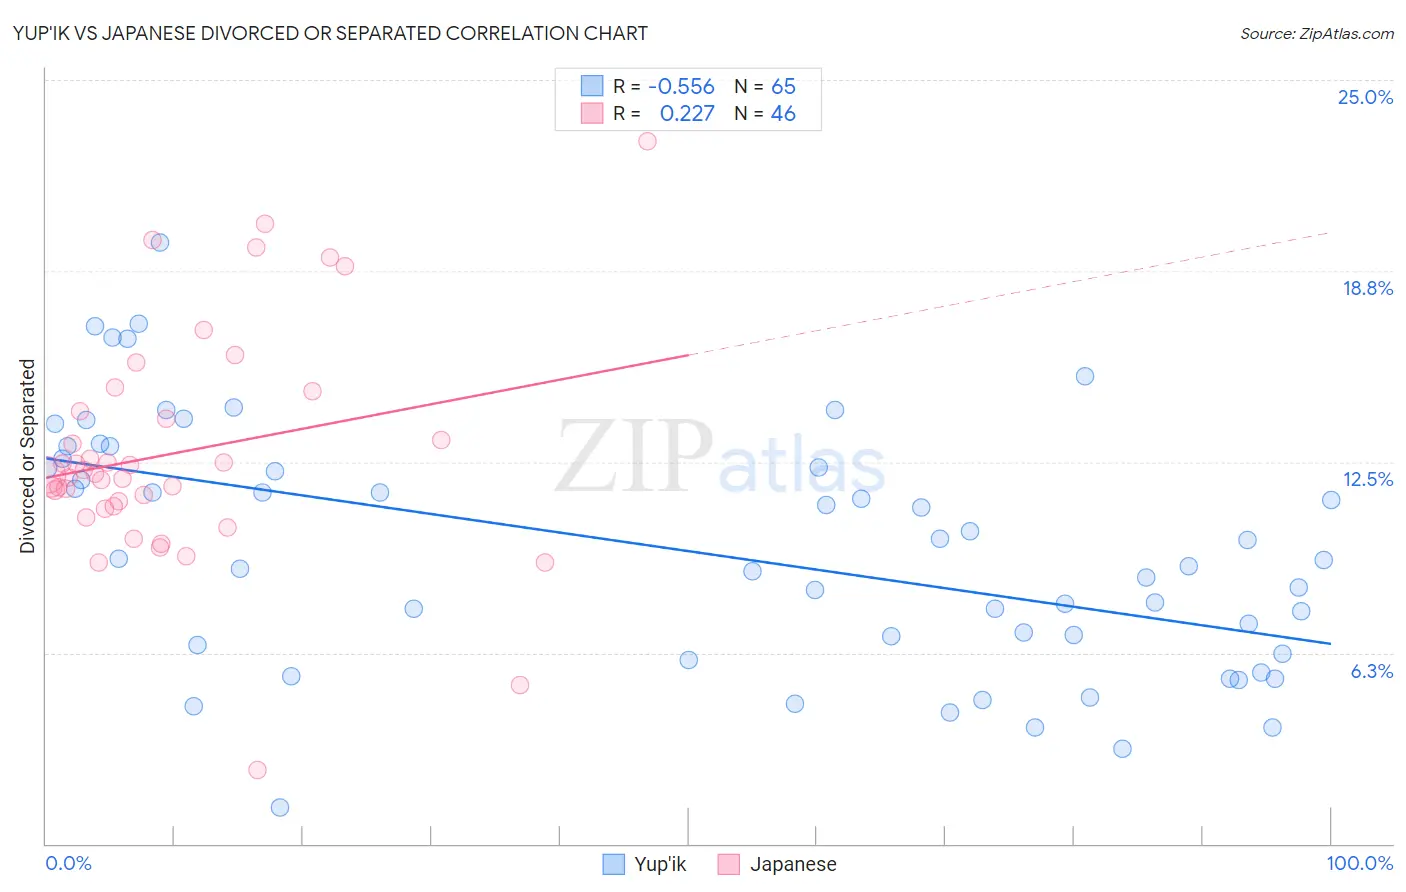
Yup'ik vs Japanese Divorced or Separated Correlation Chart
The statistical analysis conducted on geographies consisting of 39,962,482 people shows a substantial negative correlation between the proportion of Yup'ik and percentage of population currently divorced or separated in the United States with a correlation coefficient (R) of -0.556 and weighted average of 10.3%. Similarly, the statistical analysis conducted on geographies consisting of 249,125,963 people shows a weak positive correlation between the proportion of Japanese and percentage of population currently divorced or separated in the United States with a correlation coefficient (R) of 0.227 and weighted average of 12.0%, a difference of 16.4%.
Divorced or Separated Correlation Summary
| Measurement | Yup'ik | Japanese |
| Minimum | 1.2% | 2.4% |
| Maximum | 19.7% | 23.0% |
| Range | 18.5% | 20.6% |
| Mean | 9.6% | 12.8% |
| Median | 9.3% | 12.1% |
| Interquartile 25% (IQ1) | 6.4% | 11.1% |
| Interquartile 75% (IQ3) | 12.5% | 14.1% |
| Interquartile Range (IQR) | 6.1% | 3.1% |
| Standard Deviation (Sample) | 4.0% | 3.8% |
| Standard Deviation (Population) | 4.0% | 3.7% |
Similar Demographics by Divorced or Separated
Demographics Similar to Yup'ik by Divorced or Separated
In terms of divorced or separated, the demographic groups most similar to Yup'ik are Immigrants from Eastern Asia (10.2%, a difference of 0.44%), Immigrants from Singapore (10.3%, a difference of 0.53%), Thai (10.2%, a difference of 0.78%), Indian (Asian) (10.2%, a difference of 0.83%), and Immigrants from South Central Asia (10.4%, a difference of 1.5%).
| Demographics | Rating | Rank | Divorced or Separated |
| Filipinos | 100.0 /100 | #2 | Exceptional 9.9% |
| Immigrants | Hong Kong | 100.0 /100 | #3 | Exceptional 10.0% |
| Immigrants | China | 100.0 /100 | #4 | Exceptional 10.0% |
| Immigrants | India | 100.0 /100 | #5 | Exceptional 10.1% |
| Indians (Asian) | 100.0 /100 | #6 | Exceptional 10.2% |
| Thais | 100.0 /100 | #7 | Exceptional 10.2% |
| Immigrants | Eastern Asia | 100.0 /100 | #8 | Exceptional 10.2% |
| Yup'ik | 100.0 /100 | #9 | Exceptional 10.3% |
| Immigrants | Singapore | 100.0 /100 | #10 | Exceptional 10.3% |
| Immigrants | South Central Asia | 100.0 /100 | #11 | Exceptional 10.4% |
| Okinawans | 100.0 /100 | #12 | Exceptional 10.5% |
| Cypriots | 100.0 /100 | #13 | Exceptional 10.5% |
| Assyrians/Chaldeans/Syriacs | 100.0 /100 | #14 | Exceptional 10.6% |
| Immigrants | Armenia | 100.0 /100 | #15 | Exceptional 10.6% |
| Immigrants | Korea | 100.0 /100 | #16 | Exceptional 10.6% |
Demographics Similar to Japanese by Divorced or Separated
In terms of divorced or separated, the demographic groups most similar to Japanese are Chilean (12.0%, a difference of 0.020%), Hungarian (12.0%, a difference of 0.020%), Austrian (12.0%, a difference of 0.060%), Immigrants from Brazil (12.0%, a difference of 0.090%), and Immigrants from Hungary (11.9%, a difference of 0.12%).
| Demographics | Rating | Rank | Divorced or Separated |
| Italians | 77.8 /100 | #148 | Good 11.9% |
| Immigrants | Oceania | 77.7 /100 | #149 | Good 11.9% |
| Immigrants | Portugal | 77.3 /100 | #150 | Good 11.9% |
| Czechs | 76.4 /100 | #151 | Good 11.9% |
| Immigrants | Hungary | 73.7 /100 | #152 | Good 11.9% |
| Austrians | 72.2 /100 | #153 | Good 12.0% |
| Chileans | 71.3 /100 | #154 | Good 12.0% |
| Japanese | 70.9 /100 | #155 | Good 12.0% |
| Hungarians | 70.3 /100 | #156 | Good 12.0% |
| Immigrants | Brazil | 68.8 /100 | #157 | Good 12.0% |
| Icelanders | 66.0 /100 | #158 | Good 12.0% |
| Immigrants | Barbados | 66.0 /100 | #159 | Good 12.0% |
| Immigrants | Scotland | 65.8 /100 | #160 | Good 12.0% |
| Marshallese | 64.6 /100 | #161 | Good 12.0% |
| Samoans | 64.3 /100 | #162 | Good 12.0% |