Immigrants from Israel vs South African Single Mother Households
COMPARE
Immigrants from Israel
South African
Single Mother Households
Single Mother Households Comparison
Immigrants from Israel
South Africans
5.0%
SINGLE MOTHER HOUSEHOLDS
99.9/ 100
METRIC RATING
10th/ 347
METRIC RANK
5.8%
SINGLE MOTHER HOUSEHOLDS
94.1/ 100
METRIC RATING
119th/ 347
METRIC RANK
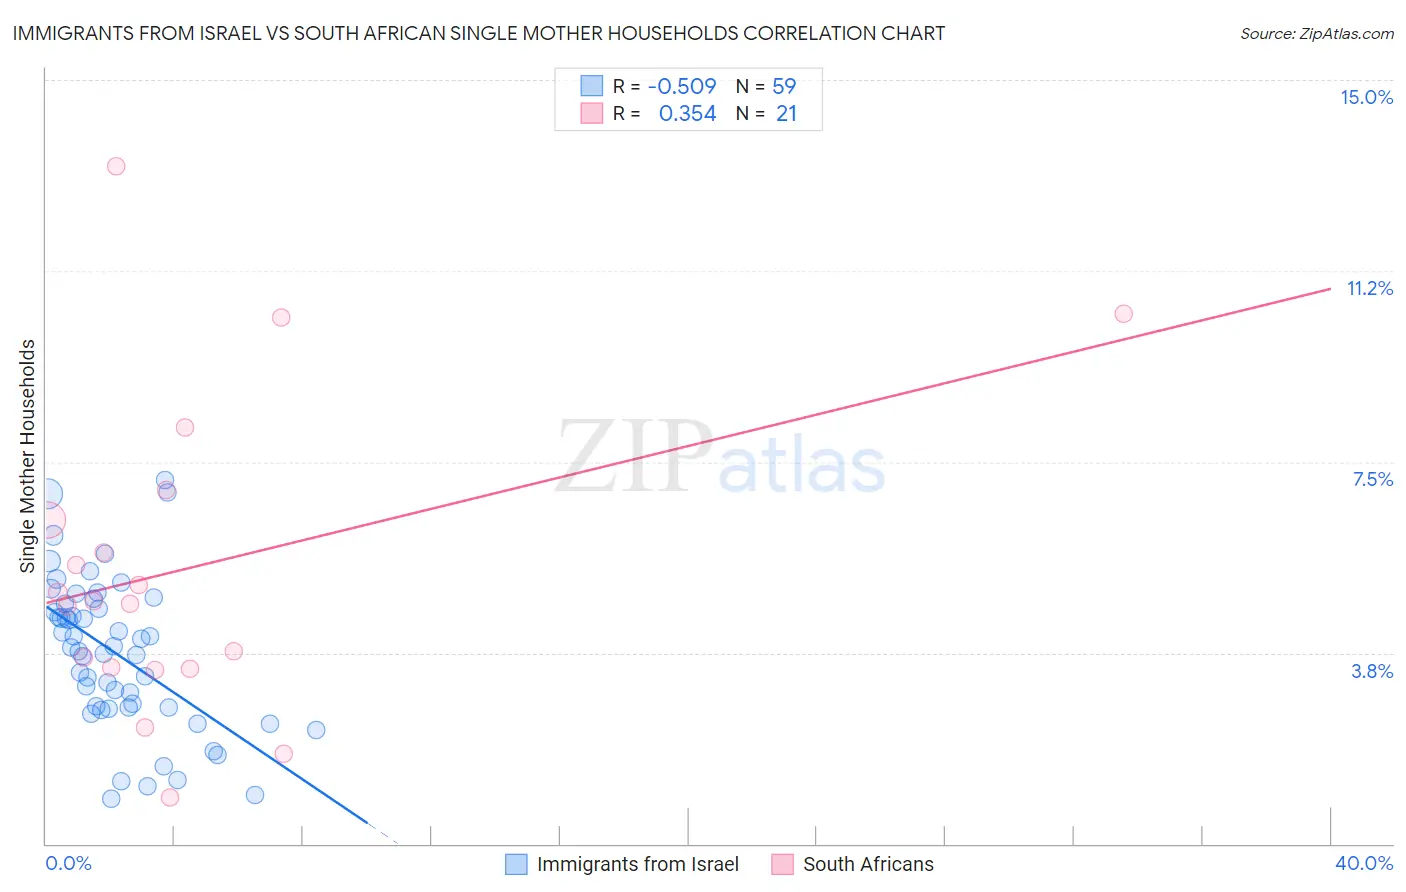
Immigrants from Israel vs South African Single Mother Households Correlation Chart
The statistical analysis conducted on geographies consisting of 209,589,874 people shows a substantial negative correlation between the proportion of Immigrants from Israel and percentage of single mother households in the United States with a correlation coefficient (R) of -0.509 and weighted average of 5.0%. Similarly, the statistical analysis conducted on geographies consisting of 182,301,498 people shows a mild positive correlation between the proportion of South Africans and percentage of single mother households in the United States with a correlation coefficient (R) of 0.354 and weighted average of 5.8%, a difference of 16.0%.
Single Mother Households Correlation Summary
| Measurement | Immigrants from Israel | South African |
| Minimum | 0.87% | 0.92% |
| Maximum | 7.1% | 13.3% |
| Range | 6.3% | 12.4% |
| Mean | 3.7% | 5.4% |
| Median | 3.9% | 4.8% |
| Interquartile 25% (IQ1) | 2.7% | 3.5% |
| Interquartile 75% (IQ3) | 4.7% | 6.7% |
| Interquartile Range (IQR) | 2.0% | 3.2% |
| Standard Deviation (Sample) | 1.5% | 3.0% |
| Standard Deviation (Population) | 1.5% | 3.0% |
Similar Demographics by Single Mother Households
Demographics Similar to Immigrants from Israel by Single Mother Households
In terms of single mother households, the demographic groups most similar to Immigrants from Israel are Okinawan (5.0%, a difference of 0.34%), Immigrants from Ireland (5.0%, a difference of 0.49%), Immigrants from China (5.1%, a difference of 0.63%), Cypriot (5.1%, a difference of 0.81%), and Immigrants from India (5.1%, a difference of 0.94%).
| Demographics | Rating | Rank | Single Mother Households |
| Immigrants | Iran | 100.0 /100 | #3 | Exceptional 4.8% |
| Assyrians/Chaldeans/Syriacs | 100.0 /100 | #4 | Exceptional 4.8% |
| Immigrants | Hong Kong | 100.0 /100 | #5 | Exceptional 4.8% |
| Immigrants | Singapore | 100.0 /100 | #6 | Exceptional 5.0% |
| Iranians | 100.0 /100 | #7 | Exceptional 5.0% |
| Immigrants | Ireland | 99.9 /100 | #8 | Exceptional 5.0% |
| Okinawans | 99.9 /100 | #9 | Exceptional 5.0% |
| Immigrants | Israel | 99.9 /100 | #10 | Exceptional 5.0% |
| Immigrants | China | 99.9 /100 | #11 | Exceptional 5.1% |
| Cypriots | 99.9 /100 | #12 | Exceptional 5.1% |
| Immigrants | India | 99.9 /100 | #13 | Exceptional 5.1% |
| Immigrants | Australia | 99.9 /100 | #14 | Exceptional 5.1% |
| Immigrants | Eastern Asia | 99.9 /100 | #15 | Exceptional 5.1% |
| Indians (Asian) | 99.9 /100 | #16 | Exceptional 5.1% |
| Soviet Union | 99.9 /100 | #17 | Exceptional 5.1% |
Demographics Similar to South Africans by Single Mother Households
In terms of single mother households, the demographic groups most similar to South Africans are Laotian (5.8%, a difference of 0.11%), Tongan (5.8%, a difference of 0.19%), Argentinean (5.8%, a difference of 0.22%), Bolivian (5.8%, a difference of 0.28%), and Belgian (5.8%, a difference of 0.30%).
| Demographics | Rating | Rank | Single Mother Households |
| Immigrants | Kuwait | 95.4 /100 | #112 | Exceptional 5.8% |
| Mongolians | 95.3 /100 | #113 | Exceptional 5.8% |
| Dutch | 95.1 /100 | #114 | Exceptional 5.8% |
| Irish | 94.8 /100 | #115 | Exceptional 5.8% |
| Pennsylvania Germans | 94.7 /100 | #116 | Exceptional 5.8% |
| Bolivians | 94.6 /100 | #117 | Exceptional 5.8% |
| Laotians | 94.3 /100 | #118 | Exceptional 5.8% |
| South Africans | 94.1 /100 | #119 | Exceptional 5.8% |
| Tongans | 93.7 /100 | #120 | Exceptional 5.8% |
| Argentineans | 93.7 /100 | #121 | Exceptional 5.8% |
| Belgians | 93.5 /100 | #122 | Exceptional 5.8% |
| Immigrants | Uzbekistan | 93.4 /100 | #123 | Exceptional 5.9% |
| Immigrants | Argentina | 93.2 /100 | #124 | Exceptional 5.9% |
| Slavs | 92.9 /100 | #125 | Exceptional 5.9% |
| Welsh | 92.8 /100 | #126 | Exceptional 5.9% |