Immigrants from Philippines vs Immigrants from Sudan Family Households with Children
COMPARE
Immigrants from Philippines
Immigrants from Sudan
Family Households with Children
Family Households with Children Comparison
Immigrants from Philippines
Immigrants from Sudan
29.0%
FAMILY HOUSEHOLDS WITH CHILDREN
100.0/ 100
METRIC RATING
46th/ 347
METRIC RANK
27.3%
FAMILY HOUSEHOLDS WITH CHILDREN
21.6/ 100
METRIC RATING
204th/ 347
METRIC RANK
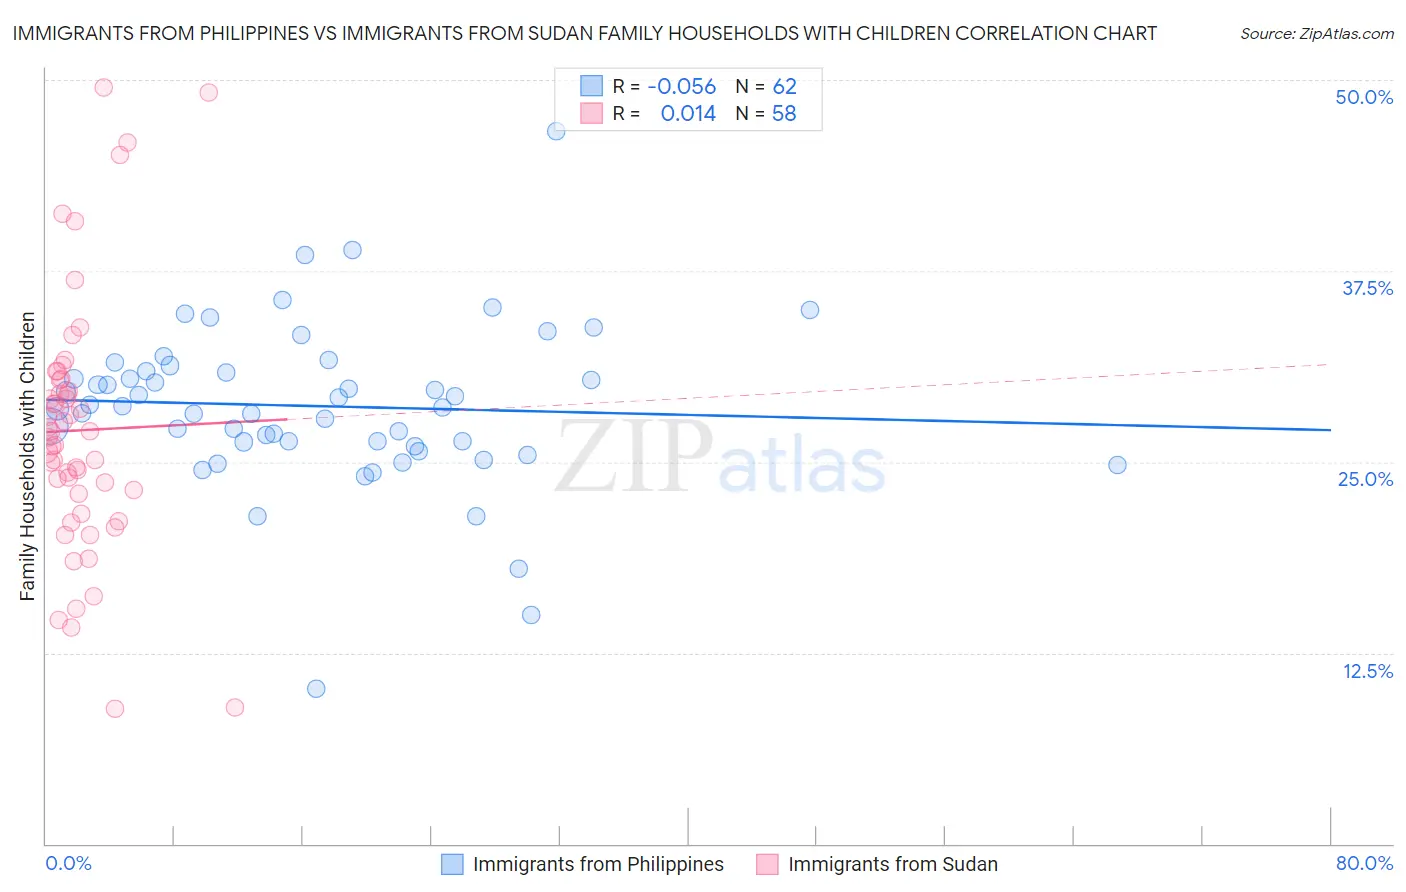
Immigrants from Philippines vs Immigrants from Sudan Family Households with Children Correlation Chart
The statistical analysis conducted on geographies consisting of 470,847,260 people shows a slight negative correlation between the proportion of Immigrants from Philippines and percentage of family households with children in the United States with a correlation coefficient (R) of -0.056 and weighted average of 29.0%. Similarly, the statistical analysis conducted on geographies consisting of 118,939,836 people shows no correlation between the proportion of Immigrants from Sudan and percentage of family households with children in the United States with a correlation coefficient (R) of 0.014 and weighted average of 27.3%, a difference of 6.4%.
Family Households with Children Correlation Summary
| Measurement | Immigrants from Philippines | Immigrants from Sudan |
| Minimum | 10.2% | 8.8% |
| Maximum | 46.7% | 49.5% |
| Range | 36.5% | 40.7% |
| Mean | 28.7% | 27.1% |
| Median | 28.6% | 26.8% |
| Interquartile 25% (IQ1) | 26.3% | 22.9% |
| Interquartile 75% (IQ3) | 31.0% | 30.4% |
| Interquartile Range (IQR) | 4.7% | 7.4% |
| Standard Deviation (Sample) | 5.4% | 8.5% |
| Standard Deviation (Population) | 5.4% | 8.4% |
Similar Demographics by Family Households with Children
Demographics Similar to Immigrants from Philippines by Family Households with Children
In terms of family households with children, the demographic groups most similar to Immigrants from Philippines are Peruvian (29.0%, a difference of 0.010%), Apache (29.0%, a difference of 0.040%), Fijian (29.0%, a difference of 0.090%), Jordanian (29.0%, a difference of 0.13%), and Immigrants from Taiwan (29.0%, a difference of 0.14%).
| Demographics | Rating | Rank | Family Households with Children |
| Yaqui | 100.0 /100 | #39 | Exceptional 29.1% |
| Central Americans | 100.0 /100 | #40 | Exceptional 29.1% |
| Immigrants | South Eastern Asia | 100.0 /100 | #41 | Exceptional 29.1% |
| Spanish American Indians | 100.0 /100 | #42 | Exceptional 29.1% |
| Asians | 100.0 /100 | #43 | Exceptional 29.1% |
| Immigrants | Taiwan | 100.0 /100 | #44 | Exceptional 29.0% |
| Fijians | 100.0 /100 | #45 | Exceptional 29.0% |
| Immigrants | Philippines | 100.0 /100 | #46 | Exceptional 29.0% |
| Peruvians | 100.0 /100 | #47 | Exceptional 29.0% |
| Apache | 100.0 /100 | #48 | Exceptional 29.0% |
| Jordanians | 100.0 /100 | #49 | Exceptional 29.0% |
| Immigrants | Immigrants | 100.0 /100 | #50 | Exceptional 28.9% |
| Immigrants | Peru | 100.0 /100 | #51 | Exceptional 28.9% |
| Guatemalans | 100.0 /100 | #52 | Exceptional 28.9% |
| Immigrants | Cambodia | 100.0 /100 | #53 | Exceptional 28.9% |
Demographics Similar to Immigrants from Sudan by Family Households with Children
In terms of family households with children, the demographic groups most similar to Immigrants from Sudan are Kiowa (27.3%, a difference of 0.020%), American (27.3%, a difference of 0.040%), Immigrants from Haiti (27.2%, a difference of 0.050%), Immigrants from Micronesia (27.2%, a difference of 0.050%), and Haitian (27.2%, a difference of 0.060%).
| Demographics | Rating | Rank | Family Households with Children |
| Norwegians | 35.0 /100 | #197 | Fair 27.4% |
| Immigrants | Romania | 34.4 /100 | #198 | Fair 27.4% |
| English | 32.0 /100 | #199 | Fair 27.3% |
| Immigrants | Congo | 28.7 /100 | #200 | Fair 27.3% |
| Bhutanese | 25.1 /100 | #201 | Fair 27.3% |
| Americans | 22.8 /100 | #202 | Fair 27.3% |
| Kiowa | 22.2 /100 | #203 | Fair 27.3% |
| Immigrants | Sudan | 21.6 /100 | #204 | Fair 27.3% |
| Immigrants | Haiti | 20.3 /100 | #205 | Fair 27.2% |
| Immigrants | Micronesia | 20.2 /100 | #206 | Fair 27.2% |
| Haitians | 19.8 /100 | #207 | Poor 27.2% |
| Immigrants | Poland | 16.4 /100 | #208 | Poor 27.2% |
| Dutch West Indians | 15.8 /100 | #209 | Poor 27.2% |
| Immigrants | Ukraine | 14.4 /100 | #210 | Poor 27.2% |
| Welsh | 14.2 /100 | #211 | Poor 27.2% |