Immigrants from Philippines vs Arab Median Male Earnings
COMPARE
Immigrants from Philippines
Arab
Median Male Earnings
Median Male Earnings Comparison
Immigrants from Philippines
Arabs
$55,809
MEDIAN MALE EARNINGS
78.4/ 100
METRIC RATING
147th/ 347
METRIC RANK
$57,298
MEDIAN MALE EARNINGS
94.0/ 100
METRIC RATING
119th/ 347
METRIC RANK
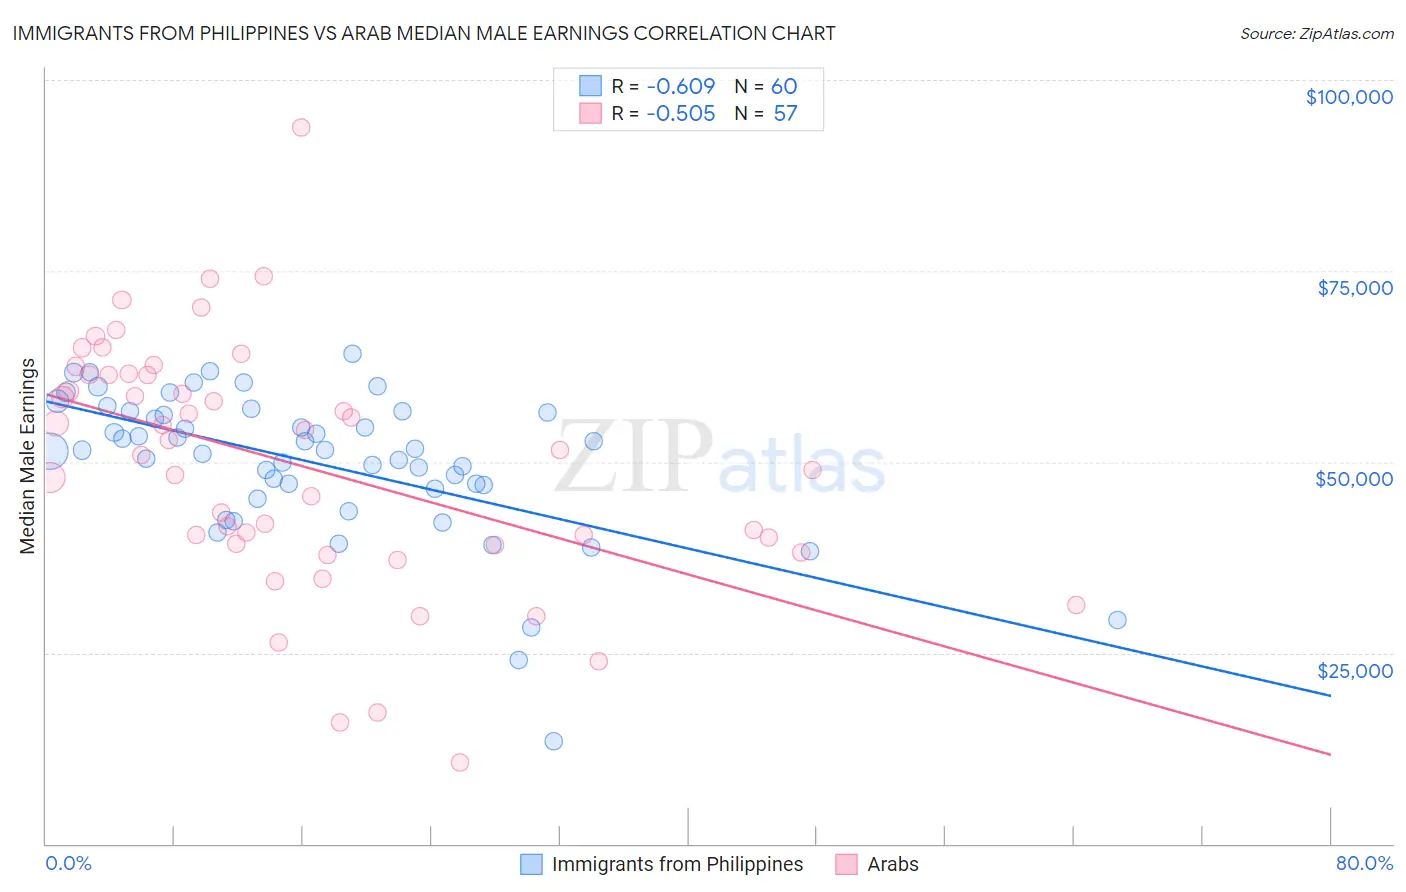
Immigrants from Philippines vs Arab Median Male Earnings Correlation Chart
The statistical analysis conducted on geographies consisting of 471,105,700 people shows a significant negative correlation between the proportion of Immigrants from Philippines and median male earnings in the United States with a correlation coefficient (R) of -0.609 and weighted average of $55,809. Similarly, the statistical analysis conducted on geographies consisting of 486,638,501 people shows a substantial negative correlation between the proportion of Arabs and median male earnings in the United States with a correlation coefficient (R) of -0.505 and weighted average of $57,298, a difference of 2.7%.
Median Male Earnings Correlation Summary
| Measurement | Immigrants from Philippines | Arab |
| Minimum | $13,438 | $10,662 |
| Maximum | $64,188 | $93,845 |
| Range | $50,750 | $83,183 |
| Mean | $49,896 | $49,636 |
| Median | $51,541 | $51,622 |
| Interquartile 25% (IQ1) | $46,774 | $39,178 |
| Interquartile 75% (IQ3) | $56,545 | $61,412 |
| Interquartile Range (IQR) | $9,771 | $22,233 |
| Standard Deviation (Sample) | $9,645 | $16,136 |
| Standard Deviation (Population) | $9,565 | $15,994 |
Similar Demographics by Median Male Earnings
Demographics Similar to Immigrants from Philippines by Median Male Earnings
In terms of median male earnings, the demographic groups most similar to Immigrants from Philippines are Scottish ($55,793, a difference of 0.030%), English ($55,747, a difference of 0.11%), Swiss ($55,731, a difference of 0.14%), Immigrants from Oceania ($55,712, a difference of 0.17%), and Immigrants from Chile ($55,954, a difference of 0.26%).
| Demographics | Rating | Rank | Median Male Earnings |
| Luxembourgers | 85.5 /100 | #140 | Excellent $56,300 |
| Danes | 84.8 /100 | #141 | Excellent $56,246 |
| Ethiopians | 84.8 /100 | #142 | Excellent $56,243 |
| Sri Lankans | 83.4 /100 | #143 | Excellent $56,136 |
| Immigrants | Uganda | 82.4 /100 | #144 | Excellent $56,064 |
| Norwegians | 80.9 /100 | #145 | Excellent $55,965 |
| Immigrants | Chile | 80.7 /100 | #146 | Excellent $55,954 |
| Immigrants | Philippines | 78.4 /100 | #147 | Good $55,809 |
| Scottish | 78.2 /100 | #148 | Good $55,793 |
| English | 77.4 /100 | #149 | Good $55,747 |
| Swiss | 77.1 /100 | #150 | Good $55,731 |
| Immigrants | Oceania | 76.8 /100 | #151 | Good $55,712 |
| Peruvians | 75.8 /100 | #152 | Good $55,659 |
| Immigrants | Nepal | 75.0 /100 | #153 | Good $55,615 |
| Taiwanese | 73.9 /100 | #154 | Good $55,556 |
Demographics Similar to Arabs by Median Male Earnings
In terms of median male earnings, the demographic groups most similar to Arabs are Hungarian ($57,309, a difference of 0.020%), Canadian ($57,286, a difference of 0.020%), Immigrants from Zimbabwe ($57,352, a difference of 0.090%), Lebanese ($57,409, a difference of 0.19%), and Immigrants from Albania ($57,179, a difference of 0.21%).
| Demographics | Rating | Rank | Median Male Earnings |
| Immigrants | Afghanistan | 95.4 /100 | #112 | Exceptional $57,582 |
| Carpatho Rusyns | 95.3 /100 | #113 | Exceptional $57,572 |
| Immigrants | Kuwait | 95.3 /100 | #114 | Exceptional $57,562 |
| Swedes | 94.8 /100 | #115 | Exceptional $57,445 |
| Lebanese | 94.6 /100 | #116 | Exceptional $57,409 |
| Immigrants | Zimbabwe | 94.3 /100 | #117 | Exceptional $57,352 |
| Hungarians | 94.0 /100 | #118 | Exceptional $57,309 |
| Arabs | 94.0 /100 | #119 | Exceptional $57,298 |
| Canadians | 93.9 /100 | #120 | Exceptional $57,286 |
| Immigrants | Albania | 93.3 /100 | #121 | Exceptional $57,179 |
| Immigrants | Jordan | 93.1 /100 | #122 | Exceptional $57,145 |
| Slovenes | 93.1 /100 | #123 | Exceptional $57,145 |
| Chileans | 91.9 /100 | #124 | Exceptional $56,973 |
| Immigrants | Morocco | 91.8 /100 | #125 | Exceptional $56,958 |
| Chinese | 91.1 /100 | #126 | Exceptional $56,872 |