Immigrants from Peru vs Cherokee Births to Unmarried Women
COMPARE
Immigrants from Peru
Cherokee
Births to Unmarried Women
Births to Unmarried Women Comparison
Immigrants from Peru
Cherokee
31.8%
BIRTHS TO UNMARRIED WOMEN
45.1/ 100
METRIC RATING
181st/ 347
METRIC RANK
36.7%
BIRTHS TO UNMARRIED WOMEN
0.1/ 100
METRIC RATING
265th/ 347
METRIC RANK
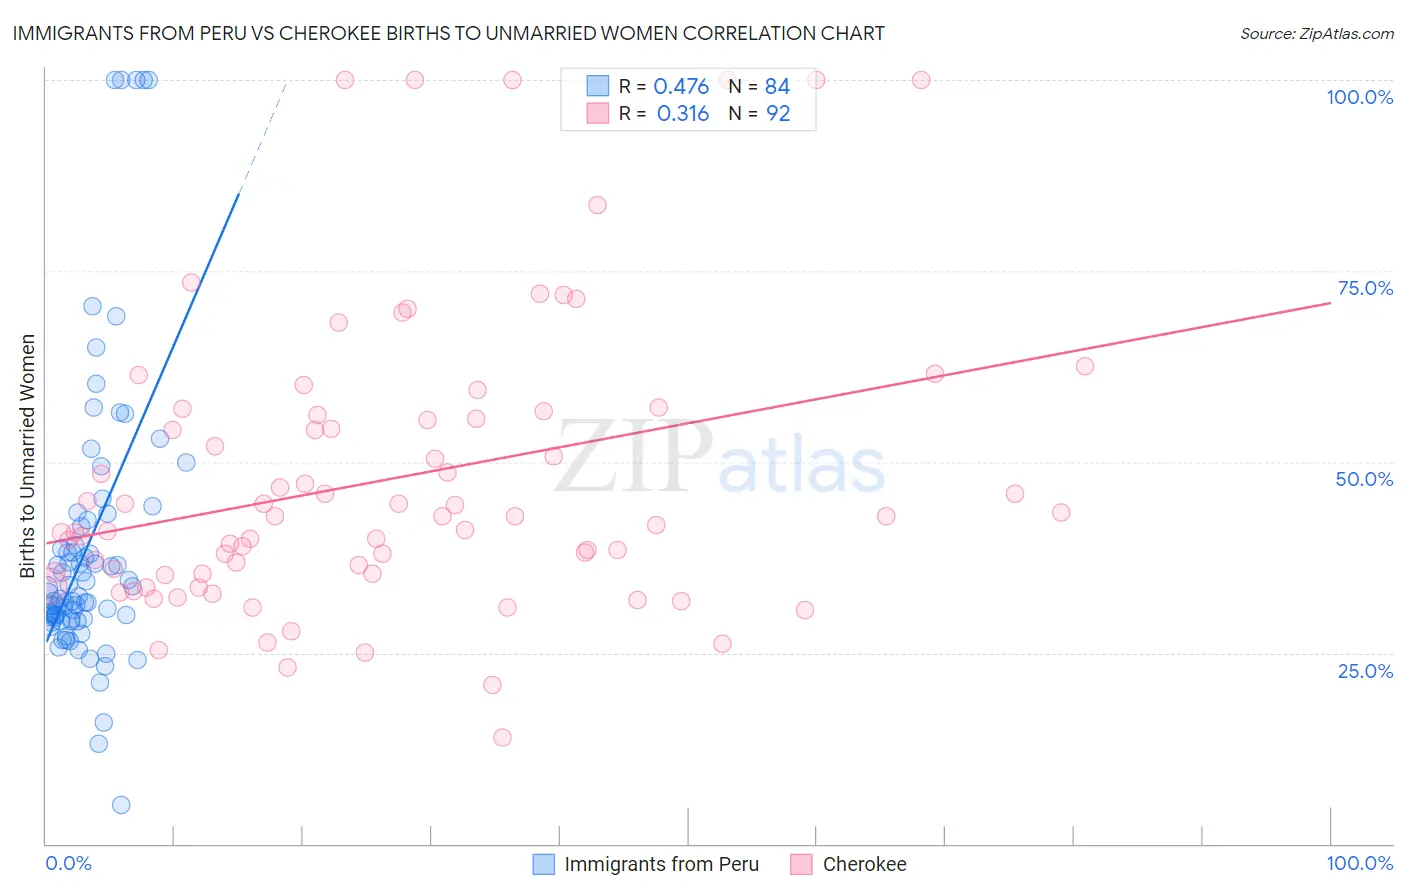
Immigrants from Peru vs Cherokee Births to Unmarried Women Correlation Chart
The statistical analysis conducted on geographies consisting of 311,348,081 people shows a moderate positive correlation between the proportion of Immigrants from Peru and percentage of births to unmarried women in the United States with a correlation coefficient (R) of 0.476 and weighted average of 31.8%. Similarly, the statistical analysis conducted on geographies consisting of 454,419,943 people shows a mild positive correlation between the proportion of Cherokee and percentage of births to unmarried women in the United States with a correlation coefficient (R) of 0.316 and weighted average of 36.7%, a difference of 15.2%.
Births to Unmarried Women Correlation Summary
| Measurement | Immigrants from Peru | Cherokee |
| Minimum | 5.1% | 13.9% |
| Maximum | 100.0% | 100.0% |
| Range | 94.9% | 86.1% |
| Mean | 39.0% | 47.7% |
| Median | 32.5% | 42.9% |
| Interquartile 25% (IQ1) | 29.5% | 35.4% |
| Interquartile 75% (IQ3) | 41.9% | 55.8% |
| Interquartile Range (IQR) | 12.4% | 20.5% |
| Standard Deviation (Sample) | 19.1% | 19.1% |
| Standard Deviation (Population) | 18.9% | 19.0% |
Similar Demographics by Births to Unmarried Women
Demographics Similar to Immigrants from Peru by Births to Unmarried Women
In terms of births to unmarried women, the demographic groups most similar to Immigrants from Peru are Moroccan (31.8%, a difference of 0.060%), South American (31.8%, a difference of 0.18%), Kenyan (31.9%, a difference of 0.20%), English (31.7%, a difference of 0.22%), and South American Indian (31.7%, a difference of 0.25%).
| Demographics | Rating | Rank | Births to Unmarried Women |
| Venezuelans | 50.0 /100 | #174 | Average 31.7% |
| Immigrants | Venezuela | 49.2 /100 | #175 | Average 31.7% |
| Scottish | 48.1 /100 | #176 | Average 31.7% |
| South American Indians | 47.7 /100 | #177 | Average 31.7% |
| English | 47.4 /100 | #178 | Average 31.7% |
| South Americans | 46.9 /100 | #179 | Average 31.8% |
| Moroccans | 45.7 /100 | #180 | Average 31.8% |
| Immigrants | Peru | 45.1 /100 | #181 | Average 31.8% |
| Kenyans | 43.0 /100 | #182 | Average 31.9% |
| Canadians | 41.4 /100 | #183 | Average 31.9% |
| Immigrants | South America | 40.7 /100 | #184 | Average 32.0% |
| Germans | 39.5 /100 | #185 | Fair 32.0% |
| Welsh | 38.2 /100 | #186 | Fair 32.0% |
| Czechoslovakians | 38.0 /100 | #187 | Fair 32.0% |
| Osage | 37.1 /100 | #188 | Fair 32.1% |
Demographics Similar to Cherokee by Births to Unmarried Women
In terms of births to unmarried women, the demographic groups most similar to Cherokee are Subsaharan African (36.7%, a difference of 0.050%), Immigrants from Senegal (36.7%, a difference of 0.050%), Central American (36.7%, a difference of 0.12%), Comanche (36.7%, a difference of 0.13%), and Nicaraguan (36.6%, a difference of 0.17%).
| Demographics | Rating | Rank | Births to Unmarried Women |
| Americans | 0.2 /100 | #258 | Tragic 36.4% |
| Immigrants | El Salvador | 0.2 /100 | #259 | Tragic 36.4% |
| Ottawa | 0.2 /100 | #260 | Tragic 36.5% |
| Trinidadians and Tobagonians | 0.2 /100 | #261 | Tragic 36.5% |
| French American Indians | 0.1 /100 | #262 | Tragic 36.6% |
| Nicaraguans | 0.1 /100 | #263 | Tragic 36.6% |
| Sub-Saharan Africans | 0.1 /100 | #264 | Tragic 36.7% |
| Cherokee | 0.1 /100 | #265 | Tragic 36.7% |
| Immigrants | Senegal | 0.1 /100 | #266 | Tragic 36.7% |
| Central Americans | 0.1 /100 | #267 | Tragic 36.7% |
| Comanche | 0.1 /100 | #268 | Tragic 36.7% |
| Senegalese | 0.1 /100 | #269 | Tragic 36.8% |
| Immigrants | Congo | 0.1 /100 | #270 | Tragic 36.8% |
| Immigrants | Barbados | 0.1 /100 | #271 | Tragic 36.8% |
| Choctaw | 0.1 /100 | #272 | Tragic 36.9% |