Filipino vs Immigrants from Caribbean Births to Unmarried Women
COMPARE
Filipino
Immigrants from Caribbean
Births to Unmarried Women
Births to Unmarried Women Comparison
Filipinos
Immigrants from Caribbean
23.0%
BIRTHS TO UNMARRIED WOMEN
100.0/ 100
METRIC RATING
3rd/ 347
METRIC RANK
39.8%
BIRTHS TO UNMARRIED WOMEN
0.0/ 100
METRIC RATING
314th/ 347
METRIC RANK
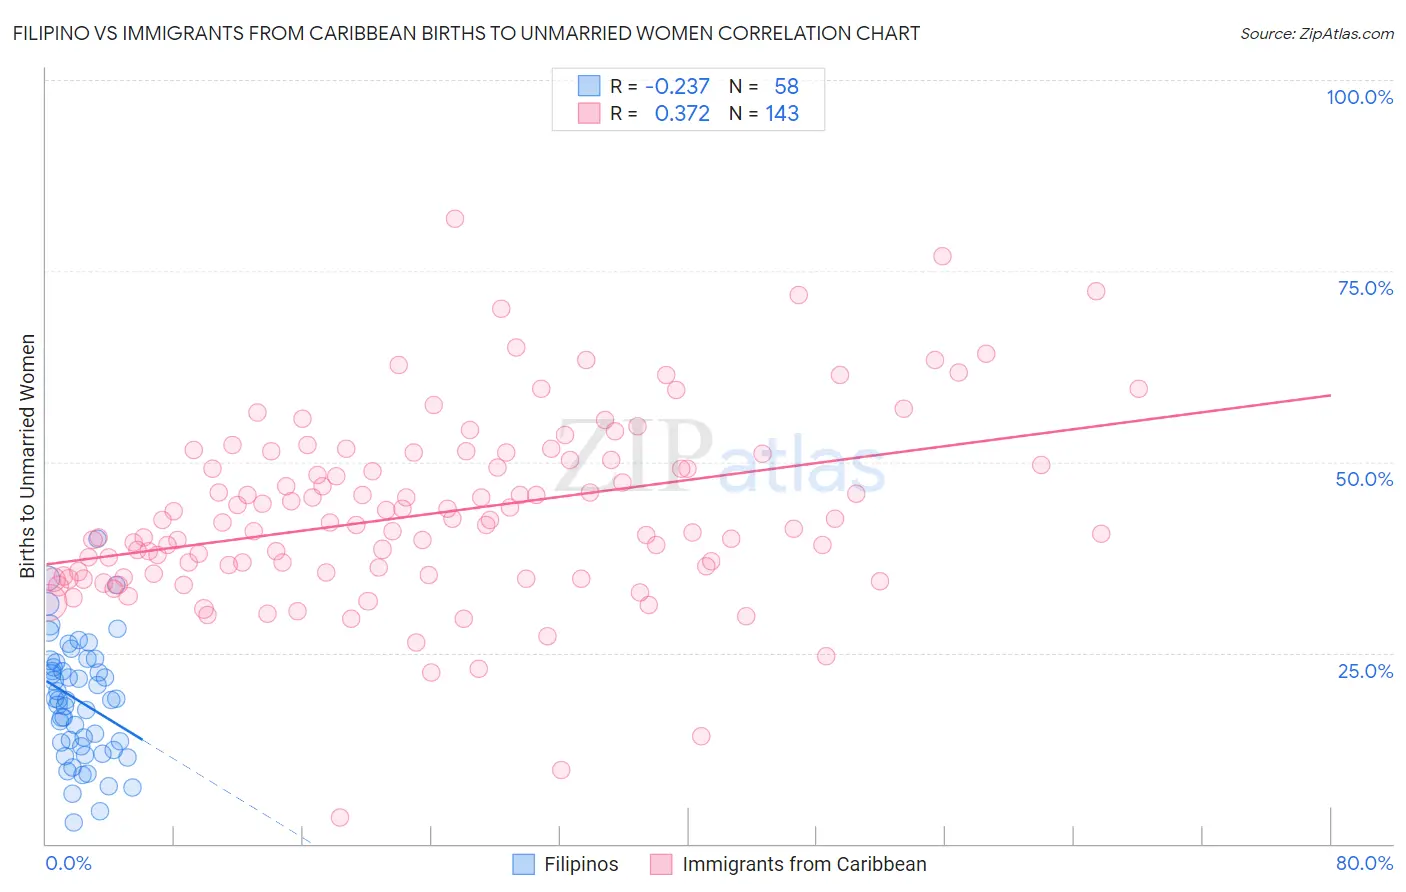
Filipino vs Immigrants from Caribbean Births to Unmarried Women Correlation Chart
The statistical analysis conducted on geographies consisting of 239,363,717 people shows a weak negative correlation between the proportion of Filipinos and percentage of births to unmarried women in the United States with a correlation coefficient (R) of -0.237 and weighted average of 23.0%. Similarly, the statistical analysis conducted on geographies consisting of 417,835,759 people shows a mild positive correlation between the proportion of Immigrants from Caribbean and percentage of births to unmarried women in the United States with a correlation coefficient (R) of 0.372 and weighted average of 39.8%, a difference of 73.3%.
Births to Unmarried Women Correlation Summary
| Measurement | Filipino | Immigrants from Caribbean |
| Minimum | 2.8% | 3.4% |
| Maximum | 40.0% | 81.8% |
| Range | 37.2% | 78.4% |
| Mean | 18.7% | 43.3% |
| Median | 18.9% | 42.0% |
| Interquartile 25% (IQ1) | 12.7% | 35.4% |
| Interquartile 75% (IQ3) | 23.7% | 50.3% |
| Interquartile Range (IQR) | 11.0% | 15.0% |
| Standard Deviation (Sample) | 7.8% | 12.1% |
| Standard Deviation (Population) | 7.7% | 12.0% |
Similar Demographics by Births to Unmarried Women
Demographics Similar to Filipinos by Births to Unmarried Women
In terms of births to unmarried women, the demographic groups most similar to Filipinos are Immigrants from Taiwan (23.0%, a difference of 0.14%), Immigrants from India (22.9%, a difference of 0.38%), Immigrants from Hong Kong (23.6%, a difference of 2.6%), Immigrants from Iran (24.0%, a difference of 4.3%), and Thai (24.0%, a difference of 4.6%).
| Demographics | Rating | Rank | Births to Unmarried Women |
| Assyrians/Chaldeans/Syriacs | 100.0 /100 | #1 | Exceptional 22.0% |
| Immigrants | India | 100.0 /100 | #2 | Exceptional 22.9% |
| Filipinos | 100.0 /100 | #3 | Exceptional 23.0% |
| Immigrants | Taiwan | 100.0 /100 | #4 | Exceptional 23.0% |
| Immigrants | Hong Kong | 100.0 /100 | #5 | Exceptional 23.6% |
| Immigrants | Iran | 100.0 /100 | #6 | Exceptional 24.0% |
| Thais | 100.0 /100 | #7 | Exceptional 24.0% |
| Immigrants | China | 100.0 /100 | #8 | Exceptional 24.7% |
| Immigrants | South Central Asia | 100.0 /100 | #9 | Exceptional 24.7% |
| Immigrants | Eastern Asia | 100.0 /100 | #10 | Exceptional 25.0% |
| Immigrants | Israel | 100.0 /100 | #11 | Exceptional 25.1% |
| Indians (Asian) | 100.0 /100 | #12 | Exceptional 25.3% |
| Iranians | 100.0 /100 | #13 | Exceptional 25.3% |
| Immigrants | Lebanon | 100.0 /100 | #14 | Exceptional 25.3% |
| Immigrants | Singapore | 100.0 /100 | #15 | Exceptional 25.6% |
Demographics Similar to Immigrants from Caribbean by Births to Unmarried Women
In terms of births to unmarried women, the demographic groups most similar to Immigrants from Caribbean are Dominican (39.8%, a difference of 0.040%), Apache (39.9%, a difference of 0.10%), African (39.7%, a difference of 0.29%), U.S. Virgin Islander (39.6%, a difference of 0.63%), and Immigrants from the Azores (39.6%, a difference of 0.65%).
| Demographics | Rating | Rank | Births to Unmarried Women |
| Immigrants | Honduras | 0.0 /100 | #307 | Tragic 39.3% |
| Aleuts | 0.0 /100 | #308 | Tragic 39.3% |
| Cubans | 0.0 /100 | #309 | Tragic 39.4% |
| Immigrants | Dominica | 0.0 /100 | #310 | Tragic 39.5% |
| Immigrants | Azores | 0.0 /100 | #311 | Tragic 39.6% |
| U.S. Virgin Islanders | 0.0 /100 | #312 | Tragic 39.6% |
| Africans | 0.0 /100 | #313 | Tragic 39.7% |
| Immigrants | Caribbean | 0.0 /100 | #314 | Tragic 39.8% |
| Dominicans | 0.0 /100 | #315 | Tragic 39.8% |
| Apache | 0.0 /100 | #316 | Tragic 39.9% |
| Immigrants | Dominican Republic | 0.0 /100 | #317 | Tragic 40.1% |
| Immigrants | Bahamas | 0.0 /100 | #318 | Tragic 40.1% |
| Yakama | 0.0 /100 | #319 | Tragic 40.3% |
| Crow | 0.0 /100 | #320 | Tragic 40.4% |
| Bahamians | 0.0 /100 | #321 | Tragic 40.8% |