Immigrants from Pakistan vs Immigrants from Costa Rica Single Father Households
COMPARE
Immigrants from Pakistan
Immigrants from Costa Rica
Single Father Households
Single Father Households Comparison
Immigrants from Pakistan
Immigrants from Costa Rica
2.1%
SINGLE FATHER HOUSEHOLDS
99.5/ 100
METRIC RATING
90th/ 347
METRIC RANK
2.4%
SINGLE FATHER HOUSEHOLDS
19.2/ 100
METRIC RATING
210th/ 347
METRIC RANK
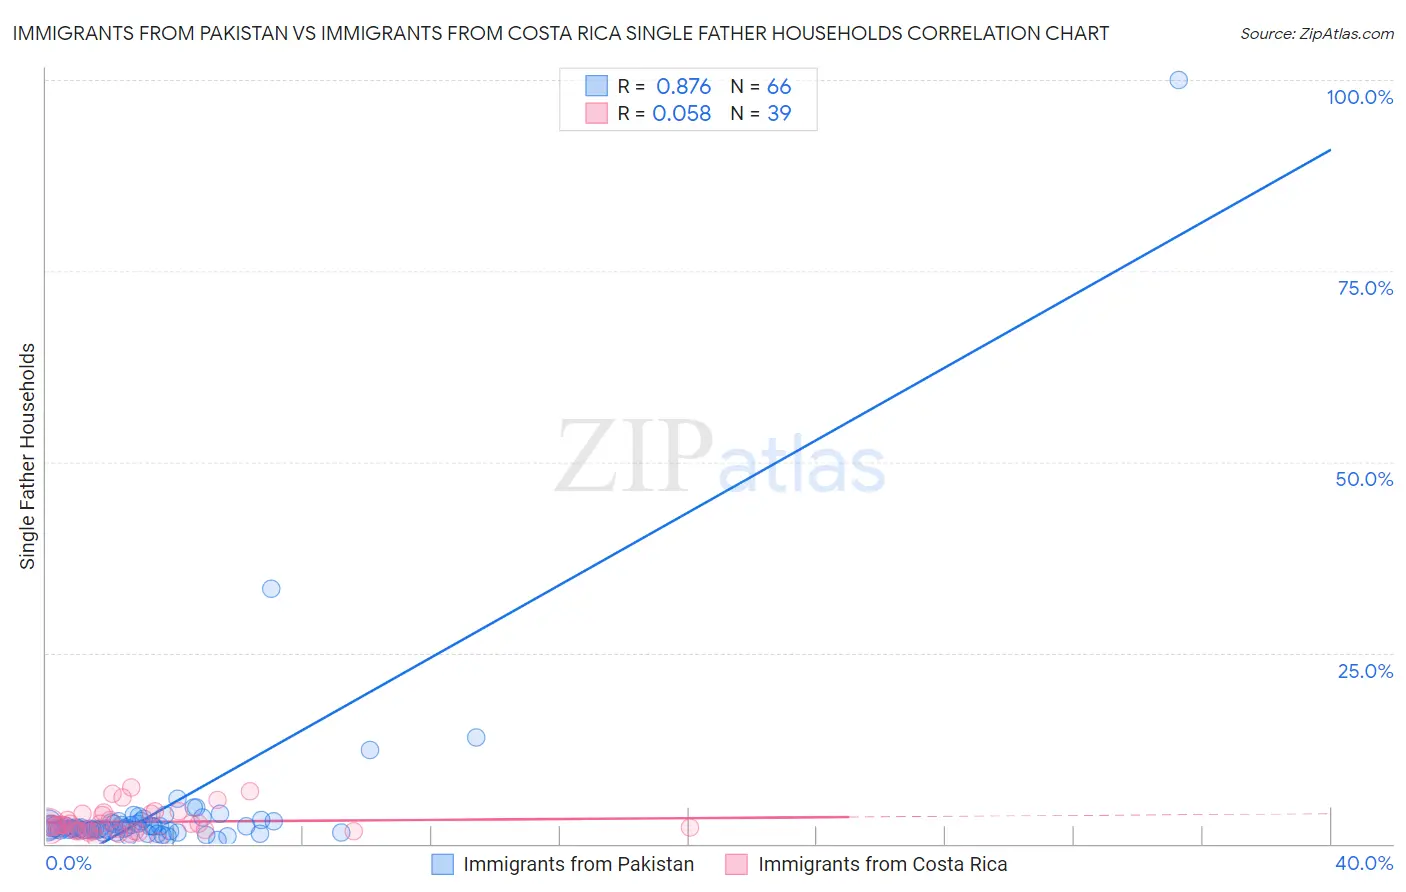
Immigrants from Pakistan vs Immigrants from Costa Rica Single Father Households Correlation Chart
The statistical analysis conducted on geographies consisting of 282,609,848 people shows a very strong positive correlation between the proportion of Immigrants from Pakistan and percentage of single father households in the United States with a correlation coefficient (R) of 0.876 and weighted average of 2.1%. Similarly, the statistical analysis conducted on geographies consisting of 203,697,810 people shows a slight positive correlation between the proportion of Immigrants from Costa Rica and percentage of single father households in the United States with a correlation coefficient (R) of 0.058 and weighted average of 2.4%, a difference of 13.5%.
Single Father Households Correlation Summary
| Measurement | Immigrants from Pakistan | Immigrants from Costa Rica |
| Minimum | 0.53% | 0.40% |
| Maximum | 100.0% | 7.3% |
| Range | 99.5% | 6.9% |
| Mean | 4.6% | 2.9% |
| Median | 2.2% | 2.5% |
| Interquartile 25% (IQ1) | 1.8% | 1.6% |
| Interquartile 75% (IQ3) | 2.9% | 3.9% |
| Interquartile Range (IQR) | 1.1% | 2.3% |
| Standard Deviation (Sample) | 12.7% | 1.7% |
| Standard Deviation (Population) | 12.6% | 1.7% |
Similar Demographics by Single Father Households
Demographics Similar to Immigrants from Pakistan by Single Father Households
In terms of single father households, the demographic groups most similar to Immigrants from Pakistan are Immigrants from Armenia (2.1%, a difference of 0.010%), Bhutanese (2.1%, a difference of 0.060%), Lithuanian (2.1%, a difference of 0.19%), Immigrants from Guyana (2.1%, a difference of 0.24%), and Romanian (2.1%, a difference of 0.33%).
| Demographics | Rating | Rank | Single Father Households |
| Greeks | 99.7 /100 | #83 | Exceptional 2.1% |
| Carpatho Rusyns | 99.6 /100 | #84 | Exceptional 2.1% |
| Immigrants | Hungary | 99.6 /100 | #85 | Exceptional 2.1% |
| Asians | 99.6 /100 | #86 | Exceptional 2.1% |
| Lithuanians | 99.5 /100 | #87 | Exceptional 2.1% |
| Bhutanese | 99.5 /100 | #88 | Exceptional 2.1% |
| Immigrants | Armenia | 99.5 /100 | #89 | Exceptional 2.1% |
| Immigrants | Pakistan | 99.5 /100 | #90 | Exceptional 2.1% |
| Immigrants | Guyana | 99.4 /100 | #91 | Exceptional 2.1% |
| Romanians | 99.4 /100 | #92 | Exceptional 2.1% |
| Croatians | 99.3 /100 | #93 | Exceptional 2.1% |
| Ukrainians | 99.3 /100 | #94 | Exceptional 2.1% |
| Bermudans | 99.2 /100 | #95 | Exceptional 2.1% |
| Arabs | 99.2 /100 | #96 | Exceptional 2.1% |
| Immigrants | Moldova | 99.1 /100 | #97 | Exceptional 2.1% |
Demographics Similar to Immigrants from Costa Rica by Single Father Households
In terms of single father households, the demographic groups most similar to Immigrants from Costa Rica are Immigrants from Peru (2.4%, a difference of 0.010%), Immigrants from Nigeria (2.4%, a difference of 0.050%), Finnish (2.4%, a difference of 0.10%), Immigrants from Kenya (2.4%, a difference of 0.13%), and Norwegian (2.4%, a difference of 0.25%).
| Demographics | Rating | Rank | Single Father Households |
| French Canadians | 24.7 /100 | #203 | Fair 2.4% |
| Ecuadorians | 24.5 /100 | #204 | Fair 2.4% |
| Immigrants | Afghanistan | 24.2 /100 | #205 | Fair 2.4% |
| Koreans | 24.1 /100 | #206 | Fair 2.4% |
| Whites/Caucasians | 22.6 /100 | #207 | Fair 2.4% |
| Immigrants | Kenya | 20.3 /100 | #208 | Fair 2.4% |
| Immigrants | Peru | 19.3 /100 | #209 | Poor 2.4% |
| Immigrants | Costa Rica | 19.2 /100 | #210 | Poor 2.4% |
| Immigrants | Nigeria | 18.7 /100 | #211 | Poor 2.4% |
| Finns | 18.3 /100 | #212 | Poor 2.4% |
| Norwegians | 17.1 /100 | #213 | Poor 2.4% |
| Ethiopians | 16.6 /100 | #214 | Poor 2.4% |
| Immigrants | South Eastern Asia | 15.9 /100 | #215 | Poor 2.4% |
| Immigrants | Ecuador | 14.9 /100 | #216 | Poor 2.4% |
| Dutch | 14.3 /100 | #217 | Poor 2.4% |