Immigrants from Oceania vs Pueblo Currently Married
COMPARE
Immigrants from Oceania
Pueblo
Currently Married
Currently Married Comparison
Immigrants from Oceania
Pueblo
46.5%
CURRENTLY MARRIED
44.6/ 100
METRIC RATING
179th/ 347
METRIC RANK
38.2%
CURRENTLY MARRIED
0.0/ 100
METRIC RATING
343rd/ 347
METRIC RANK
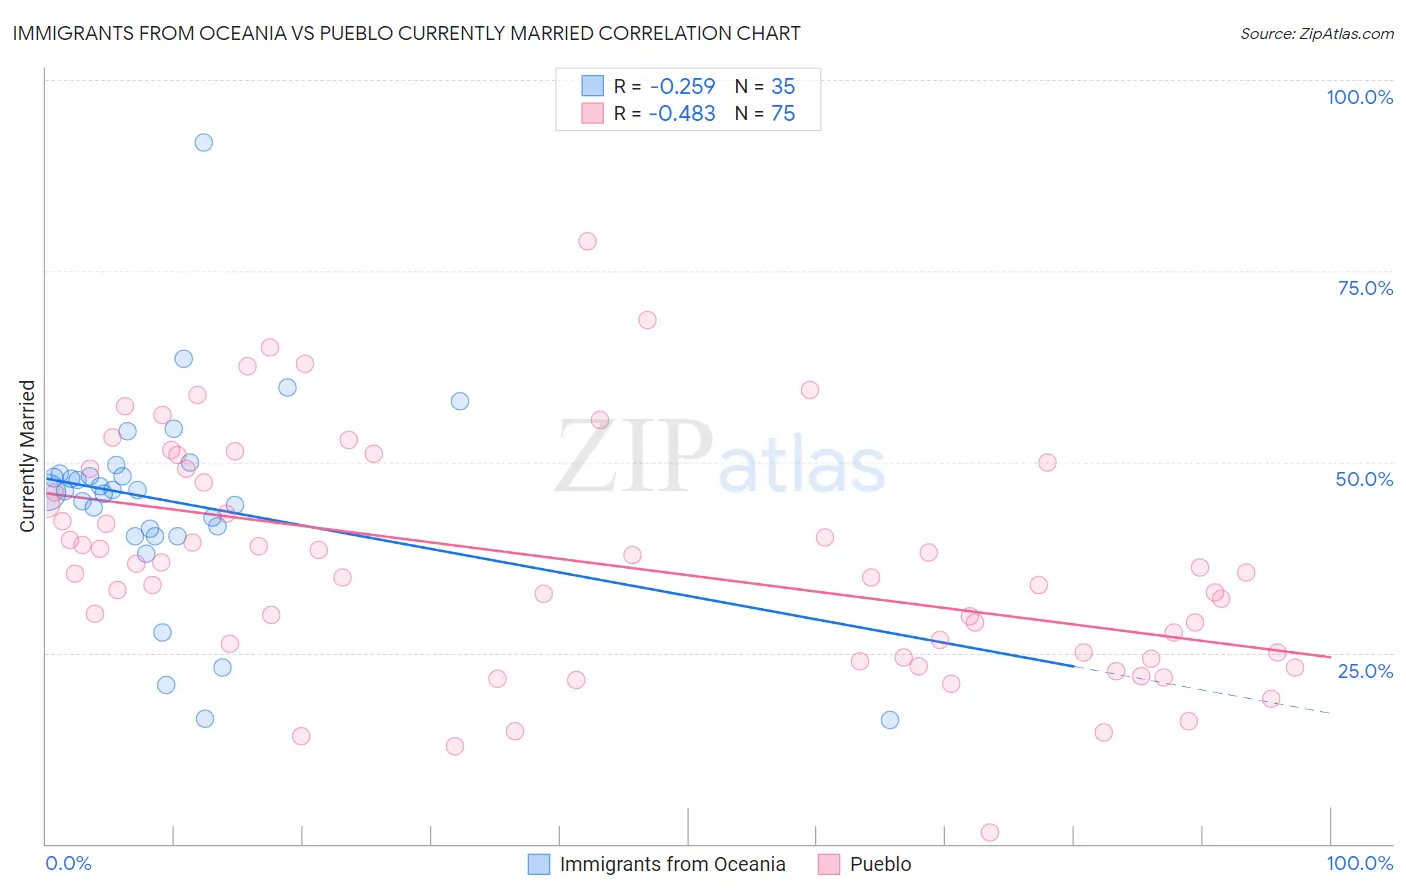
Immigrants from Oceania vs Pueblo Currently Married Correlation Chart
The statistical analysis conducted on geographies consisting of 305,491,409 people shows a weak negative correlation between the proportion of Immigrants from Oceania and percentage of population currently married in the United States with a correlation coefficient (R) of -0.259 and weighted average of 46.5%. Similarly, the statistical analysis conducted on geographies consisting of 120,084,421 people shows a moderate negative correlation between the proportion of Pueblo and percentage of population currently married in the United States with a correlation coefficient (R) of -0.483 and weighted average of 38.2%, a difference of 21.7%.
Currently Married Correlation Summary
| Measurement | Immigrants from Oceania | Pueblo |
| Minimum | 16.2% | 1.5% |
| Maximum | 91.9% | 78.9% |
| Range | 75.7% | 77.4% |
| Mean | 44.8% | 36.9% |
| Median | 46.2% | 35.5% |
| Interquartile 25% (IQ1) | 40.3% | 25.0% |
| Interquartile 75% (IQ3) | 48.5% | 49.1% |
| Interquartile Range (IQR) | 8.2% | 24.0% |
| Standard Deviation (Sample) | 13.7% | 14.9% |
| Standard Deviation (Population) | 13.5% | 14.8% |
Similar Demographics by Currently Married
Demographics Similar to Immigrants from Oceania by Currently Married
In terms of currently married, the demographic groups most similar to Immigrants from Oceania are Costa Rican (46.5%, a difference of 0.030%), Ottawa (46.5%, a difference of 0.060%), Potawatomi (46.5%, a difference of 0.10%), Chickasaw (46.6%, a difference of 0.12%), and Hawaiian (46.6%, a difference of 0.15%).
| Demographics | Rating | Rank | Currently Married |
| Aleuts | 52.0 /100 | #172 | Average 46.7% |
| Tlingit-Haida | 51.2 /100 | #173 | Average 46.7% |
| Peruvians | 50.0 /100 | #174 | Average 46.6% |
| Immigrants | Brazil | 49.9 /100 | #175 | Average 46.6% |
| Hawaiians | 48.6 /100 | #176 | Average 46.6% |
| Israelis | 48.6 /100 | #177 | Average 46.6% |
| Chickasaw | 47.8 /100 | #178 | Average 46.6% |
| Immigrants | Oceania | 44.6 /100 | #179 | Average 46.5% |
| Costa Ricans | 43.7 /100 | #180 | Average 46.5% |
| Ottawa | 43.0 /100 | #181 | Average 46.5% |
| Potawatomi | 41.9 /100 | #182 | Average 46.5% |
| Immigrants | Northern Africa | 39.7 /100 | #183 | Fair 46.5% |
| Brazilians | 39.3 /100 | #184 | Fair 46.4% |
| Mongolians | 37.6 /100 | #185 | Fair 46.4% |
| Immigrants | Chile | 36.8 /100 | #186 | Fair 46.4% |
Demographics Similar to Pueblo by Currently Married
In terms of currently married, the demographic groups most similar to Pueblo are Immigrants from Cabo Verde (37.8%, a difference of 1.1%), Immigrants from Dominican Republic (38.9%, a difference of 1.8%), Navajo (39.0%, a difference of 2.0%), Immigrants from Grenada (39.1%, a difference of 2.4%), and Dominican (39.5%, a difference of 3.4%).
| Demographics | Rating | Rank | Currently Married |
| Yup'ik | 0.0 /100 | #333 | Tragic 39.9% |
| Puerto Ricans | 0.0 /100 | #334 | Tragic 39.9% |
| Lumbee | 0.0 /100 | #335 | Tragic 39.8% |
| British West Indians | 0.0 /100 | #336 | Tragic 39.8% |
| Blacks/African Americans | 0.0 /100 | #337 | Tragic 39.6% |
| Cape Verdeans | 0.0 /100 | #338 | Tragic 39.6% |
| Dominicans | 0.0 /100 | #339 | Tragic 39.5% |
| Immigrants | Grenada | 0.0 /100 | #340 | Tragic 39.1% |
| Navajo | 0.0 /100 | #341 | Tragic 39.0% |
| Immigrants | Dominican Republic | 0.0 /100 | #342 | Tragic 38.9% |
| Pueblo | 0.0 /100 | #343 | Tragic 38.2% |
| Immigrants | Cabo Verde | 0.0 /100 | #344 | Tragic 37.8% |
| Tohono O'odham | 0.0 /100 | #345 | Tragic 36.8% |
| Hopi | 0.0 /100 | #346 | Tragic 36.5% |
| Pima | 0.0 /100 | #347 | Tragic 35.9% |