Immigrants from Oceania vs Turkish Births to Unmarried Women
COMPARE
Immigrants from Oceania
Turkish
Births to Unmarried Women
Births to Unmarried Women Comparison
Immigrants from Oceania
Turks
30.6%
BIRTHS TO UNMARRIED WOMEN
81.2/ 100
METRIC RATING
147th/ 347
METRIC RANK
27.4%
BIRTHS TO UNMARRIED WOMEN
99.6/ 100
METRIC RATING
40th/ 347
METRIC RANK
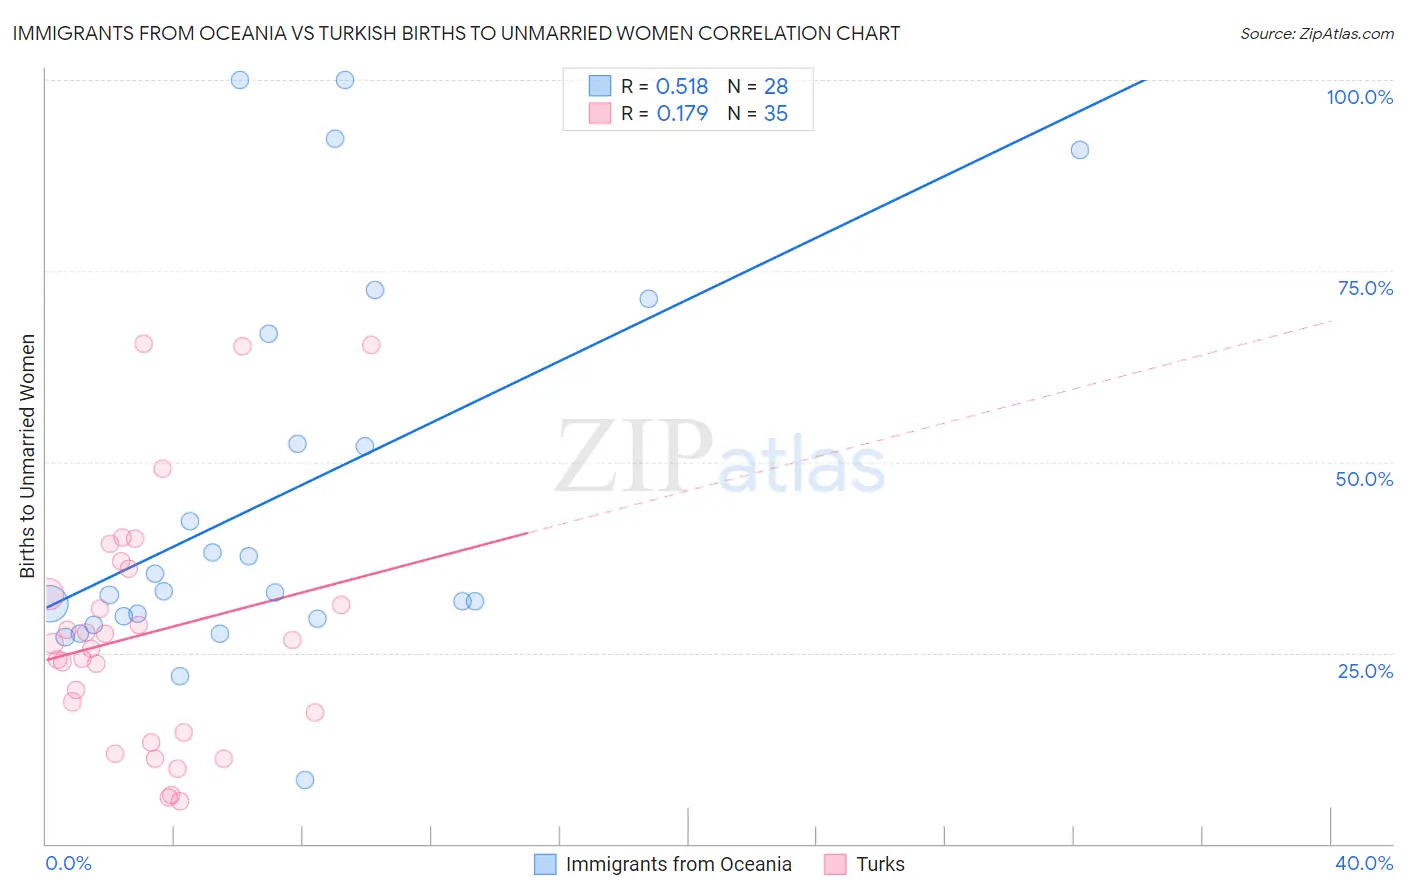
Immigrants from Oceania vs Turkish Births to Unmarried Women Correlation Chart
The statistical analysis conducted on geographies consisting of 287,126,305 people shows a substantial positive correlation between the proportion of Immigrants from Oceania and percentage of births to unmarried women in the United States with a correlation coefficient (R) of 0.518 and weighted average of 30.6%. Similarly, the statistical analysis conducted on geographies consisting of 255,026,742 people shows a poor positive correlation between the proportion of Turks and percentage of births to unmarried women in the United States with a correlation coefficient (R) of 0.179 and weighted average of 27.4%, a difference of 11.4%.
Births to Unmarried Women Correlation Summary
| Measurement | Immigrants from Oceania | Turkish |
| Minimum | 8.4% | 5.6% |
| Maximum | 100.0% | 65.5% |
| Range | 91.6% | 59.9% |
| Mean | 45.6% | 27.5% |
| Median | 33.0% | 26.3% |
| Interquartile 25% (IQ1) | 29.6% | 14.6% |
| Interquartile 75% (IQ3) | 59.6% | 36.0% |
| Interquartile Range (IQR) | 29.9% | 21.4% |
| Standard Deviation (Sample) | 25.4% | 15.9% |
| Standard Deviation (Population) | 24.9% | 15.7% |
Similar Demographics by Births to Unmarried Women
Demographics Similar to Immigrants from Oceania by Births to Unmarried Women
In terms of births to unmarried women, the demographic groups most similar to Immigrants from Oceania are Northern European (30.6%, a difference of 0.030%), Immigrants from North America (30.6%, a difference of 0.050%), Czech (30.5%, a difference of 0.15%), Immigrants from Uganda (30.5%, a difference of 0.22%), and South African (30.5%, a difference of 0.24%).
| Demographics | Rating | Rank | Births to Unmarried Women |
| Swiss | 83.1 /100 | #140 | Excellent 30.5% |
| Pakistanis | 83.0 /100 | #141 | Excellent 30.5% |
| South Africans | 82.7 /100 | #142 | Excellent 30.5% |
| Immigrants | Uganda | 82.6 /100 | #143 | Excellent 30.5% |
| Czechs | 82.1 /100 | #144 | Excellent 30.5% |
| Immigrants | North America | 81.5 /100 | #145 | Excellent 30.6% |
| Northern Europeans | 81.4 /100 | #146 | Excellent 30.6% |
| Immigrants | Oceania | 81.2 /100 | #147 | Excellent 30.6% |
| Chileans | 79.1 /100 | #148 | Good 30.7% |
| Serbians | 78.8 /100 | #149 | Good 30.7% |
| Somalis | 77.8 /100 | #150 | Good 30.7% |
| Italians | 77.0 /100 | #151 | Good 30.8% |
| Poles | 76.2 /100 | #152 | Good 30.8% |
| British | 76.0 /100 | #153 | Good 30.8% |
| Yugoslavians | 75.1 /100 | #154 | Good 30.8% |
Demographics Similar to Turks by Births to Unmarried Women
In terms of births to unmarried women, the demographic groups most similar to Turks are Immigrants from Malaysia (27.4%, a difference of 0.32%), Iraqi (27.6%, a difference of 0.41%), Immigrants from Eastern Europe (27.6%, a difference of 0.43%), Immigrants from Moldova (27.3%, a difference of 0.61%), and Immigrants from Bulgaria (27.6%, a difference of 0.66%).
| Demographics | Rating | Rank | Births to Unmarried Women |
| Immigrants | Sri Lanka | 99.8 /100 | #33 | Exceptional 27.2% |
| Immigrants | Pakistan | 99.8 /100 | #34 | Exceptional 27.2% |
| Immigrants | Ireland | 99.7 /100 | #35 | Exceptional 27.2% |
| Immigrants | Western Asia | 99.7 /100 | #36 | Exceptional 27.2% |
| Immigrants | Ukraine | 99.7 /100 | #37 | Exceptional 27.2% |
| Immigrants | Moldova | 99.7 /100 | #38 | Exceptional 27.3% |
| Immigrants | Malaysia | 99.7 /100 | #39 | Exceptional 27.4% |
| Turks | 99.6 /100 | #40 | Exceptional 27.4% |
| Iraqis | 99.6 /100 | #41 | Exceptional 27.6% |
| Immigrants | Eastern Europe | 99.6 /100 | #42 | Exceptional 27.6% |
| Immigrants | Bulgaria | 99.6 /100 | #43 | Exceptional 27.6% |
| Immigrants | Indonesia | 99.5 /100 | #44 | Exceptional 27.7% |
| Latvians | 99.5 /100 | #45 | Exceptional 27.7% |
| Immigrants | Lithuania | 99.5 /100 | #46 | Exceptional 27.7% |
| Hmong | 99.5 /100 | #47 | Exceptional 27.7% |